K-Means Kümeleme Algoritması: Mantık, K Değeri ve Python Uygulaması
Kümeleme mantığından elbow method'a, K değerinin seçiminden gerçek bir müşteri segmentasyonu uygulamasına kadar K-Means'i adım adım inceliyorum.
- Makine Öğrenmesi
- Araçlar
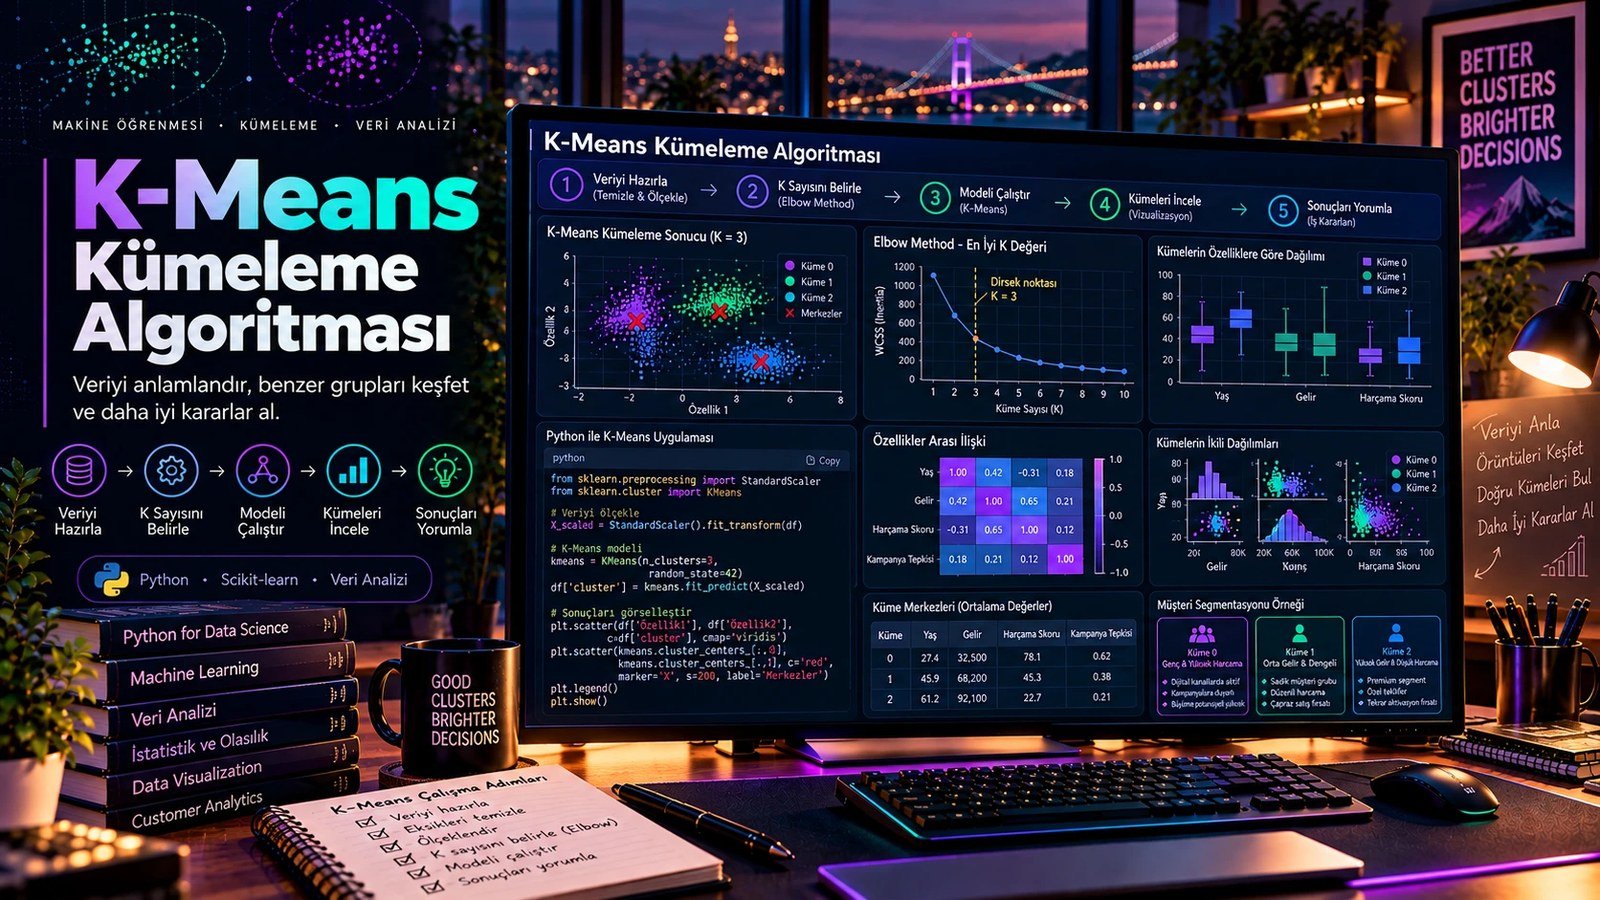
Her veri setinde elimizde önceden belirlenmiş sınıflar olmayabilir. Bazen amacımız “Bu kayıt hangi sınıfa ait?” sorusunu cevaplamak değil, “Verinin içinde doğal olarak hangi gruplar oluşuyor?” sorusunu keşfetmektir.
Kümeleme algoritmaları tam olarak bu problemi çözmeye çalışır. K-Means ise bu alanda en bilinen ve başlangıç seviyesinde öğrenilmesi en kolay yöntemlerden biri. Müşteri segmentasyonu, ürün gruplama, davranış analizi ve benzer gözlemleri bir araya getirme gibi birçok problemde kullanılabilir.
“K-Means'in amacı veriyi etiketlemek değil; verinin içindeki benzerlikleri kullanarak doğal grupları ortaya çıkarmaktır.”
K-Means Nedir?
K-Means, gözetimsiz öğrenme (unsupervised learning) kapsamında yer alan bir kümeleme algoritmasıdır. Temel fikir, gözlemleri birbirine benzer olacak şekilde K adet kümeye ayırmak ve her kümenin merkezini, yani centroid'ini iteratif olarak güncellemektir.
- Veriyi
Al - K
Seç - Merkezleri
Başlat - Kümeleri
Ata - Merkezleri
Güncelle - Tekrarla
1. Kümeleme Mantığını Basit Bir Örnekle Anlamak
Bir mağazanın müşterilerini yıllık harcama ve alışveriş sıklığı değişkenlerine göre gruplamak istediğimizi düşünelim. Veri setinde herhangi bir “VIP”, “standart” veya “potansiyel” etiketi olmadığını varsayalım.
K-Means, müşterilerin bu iki özellik üzerindeki benzerliklerini kullanarak doğal kümeler oluşturmaya çalışır.
Yüksek değerli
Yüksek harcama ve yüksek alışveriş sıklığı gösteren müşteriler.
Potansiyel
Yüksek sıklık ancak daha düşük ortalama harcama gösteren müşteriler.
Düşük etkileşim
Hem harcaması hem de alışveriş sıklığı düşük olan müşteriler.
Etiketler sonradan gelir
Küme isimlerini algoritma vermez; analist oluşan grupları yorumlar.
2. K Değeri Nedir?
K-Means'in en kritik parametresi K. K, verinin kaç kümeye ayrılacağını ifade eder.
| K | Anlamı |
|---|---|
| 2 | Veriyi 2 kümeye ayır |
| 3 | Veriyi 3 kümeye ayır |
| 4 | Veriyi 4 kümeye ayır |
| 5 | Veriyi 5 kümeye ayır |
Buradaki asıl soru şu: K değerini nereden bileceğiz? İşte bu noktada elbow method gibi yöntemlerden yararlanabiliriz.
3. K-Means Algoritması Nasıl Çalışır?
Adım 1 — Başlangıç merkezlerini seçmek
Algoritma K adet başlangıç merkezi belirler. Bu merkezler ilk aşamada rastgele veya uygun bir başlatma yöntemiyle seçilebilir.
Adım 2 — Her noktayı en yakın merkeze atamak
Her gözlemin centroid'lere olan mesafesi hesaplanır. Gözlem, kendisine en yakın merkezin bulunduğu kümeye atanır.
Adım 3 — Centroid'leri güncellemek
Her kümedeki gözlemlerin ortalaması alınarak yeni merkez hesaplanır.
Adım 4 — Atamaları tekrar yapmak
Yeni merkezler kullanılarak gözlemler yeniden kümelere atanır.
Adım 5 — Yakınsama sağlanana kadar devam etmek
Merkezler ve küme atamaları artık önemli ölçüde değişmiyorsa algoritma durur.
- Centroid
- Mesafe
- Atama
- Yeni
Centroid - Kontrol
4. K-Means Hangi Mesafeyi Kullanır?
K-Means uygulamalarında en yaygın yaklaşım, Öklid mesafesi üzerinden gözlemlerin merkezlere uzaklığını değerlendirmektir. İki boyutlu bir örnek için:
Algoritmanın temel amacı, gözlemlerin kendi kümelerindeki centroid'e olan uzaklıklarını mümkün olduğunca küçük tutmaktır.
5. Elbow Method Nedir?
Elbow method, uygun K değerini seçmek için kullanılan yaygın yöntemlerden biri. Farklı K değerleri için model çalıştırılır ve her çözümün küme içi hata değeri, yani inertia incelenir.
K arttıkça kümeler daha küçük parçalara ayrıldığı için inertia genellikle düşer. Ancak bir noktadan sonra K'yı artırmak çok daha az ek fayda sağlar.
6. Python ile Elbow Method
Python'da scikit-learn ile K-Means uygulamak oldukça kolay.
from sklearn.cluster import KMeans

inertias = []

for k in range(2, 9):
    model = KMeans(
        n_clusters=k,
        random_state=42,
        n_init="auto"
    )
    model.fit(X)
    inertias.append(model.inertia_)

# inertias listesini K değerlerine karşı çizdir
Sonuçları bir çizgi grafik üzerinde gösterdiğimizde dirsek şeklindeki kırılma noktasını arayabiliriz.
7. Gerçek Hayat Örneği: Müşteri Segmentasyonu
Şimdi küçük bir müşteri segmentasyonu problemi kuralım. Her müşteri için iki değişkenimiz olduğunu düşünelim:
| Değişken | Açıklama |
|---|---|
| Yıllık harcama | Müşterinin yıllık toplam alışveriş tutarı |
| Alışveriş sıklığı | Müşterinin yıllık işlem sayısı |
Veriyi hazırlamak
import pandas as pd

df = pd.read_csv("musteriler.csv")

X = df[["yillik_harcama", "alisveris_sikligi"]]
Ölçeklendirme neden önemli?
Örneğin yıllık harcama 5.000–100.000 aralığındayken alışveriş sıklığı 1–50 aralığında olabilir. Değişkenlerin ölçekleri çok farklıysa, büyük ölçekli değişken mesafe hesabını gereğinden fazla etkiler.
from sklearn.preprocessing import StandardScaler

scaler = StandardScaler()
X_scaled = scaler.fit_transform(X)
K-Means modelini kurmak
from sklearn.cluster import KMeans

kmeans = KMeans(
    n_clusters=3,
    random_state=42,
    n_init="auto"
)

df["cluster"] = kmeans.fit_predict(X_scaled)
Artık her müşterinin hangi kümeye atandığını cluster sütununda görebiliriz.
8. Kümeleri Yorumlamak
Algoritmanın ürettiği “0, 1, 2” gibi etiketler tek başına anlam taşımaz. Analistin görevi, kümelerin ortalama özelliklerini inceleyerek bu gruplara anlam vermektir.
segment_ozet = df.groupby("cluster")[
    ["yillik_harcama", "alisveris_sikligi"]
].mean()

print(segment_ozet)| Küme | Harcama | Sıklık | Örnek yorum |
|---|---|---|---|
| 0 | Yüksek | Yüksek | Yüksek değerli müşteriler |
| 1 | Orta | Yüksek | Aktif / potansiyel müşteriler |
| 2 | Düşük | Düşük | Düşük etkileşimli müşteriler |
Buradaki segment isimleri algoritmanın çıktısı değil; veri analistinin kümeleri iş bağlamında yorumlamasıyla ortaya çıkar.
9. K-Means Sonuçlarını Görselleştirmek
İki boyutlu bir müşteri segmentasyonunda kümeleri scatter plot ile görmek oldukça faydalı.
import matplotlib.pyplot as plt

plt.scatter(
    X_scaled[:, 0],
    X_scaled[:, 1],
    c=df["cluster"]
)

plt.xlabel("Yıllık Harcama")
plt.ylabel("Alışveriş Sıklığı")
plt.title("Müşteri Segmentleri")
plt.show()
Görselleştirme sayesinde kümelerin birbirinden ne kadar ayrıştığını ve bazı gözlemlerin neden sınıra yakın kaldığını daha kolay inceleyebiliriz.
10. K-Means'in Güçlü ve Zayıf Yönleri
Basit ve hızlı
Temel mantığı kolay anlaşılır ve büyük veri setlerinde pratik olabilir.
Yorumlanabilir
Kümelerin ortalamaları üzerinden segmentleri anlamlandırmak kolaydır.
K seçilmelidir
Küme sayısı baştan belirlenir; uygun K'yı seçmek analizin önemli bir parçasıdır.
Geometrik yapı
Küme şekilleri ve değişken ölçekleri yöntemin sonucunu etkileyebilir.
11. Nelere Dikkat Etmeli?
Ölçeği kontrol et
Mesafe tabanlı yöntemlerde değişkenlerin ölçeği sonucu doğrudan etkiler.
Tek metriğe güvenme
Elbow method'u iş problemi ve diğer metriklerle birlikte değerlendir.
Seed kullan
Farklı başlangıç merkezlerinin etkisini düşün ve sonucu tekrarlanabilir yap.
Uç gözlemler
Çok uç gözlemler centroid'leri belirgin biçimde çekebilir.
Ayrışmayı ölç
Silhouette score gibi ölçülerle küme ayrışmasını ayrıca incele.
Segmente dönüştür
Matematiksel kümeleri gerçek hayatta anlamlı segmentlere çevir.
12. Silhouette Score ile Ek Kontrol
Elbow method'un yanında kümeleme kalitesini değerlendirmek için silhouette score gibi metrikler de kullanılabilir. Bu skor, gözlemlerin kendi kümesine ne kadar yakın ve diğer kümelerden ne kadar uzak olduğunu değerlendirmeye yardımcı olur.
from sklearn.metrics import silhouette_score

score = silhouette_score(
    X_scaled,
    df["cluster"]
)

print("Silhouette Score:", score)
Bu tür metrikler K seçiminde destekleyici bilgi sağlar; ancak tek başına iş probleminin gerektirdiği segment sayısını belirlemez.
13. K-Means Ne Zaman Kullanılmalı?
| Senaryo | Uygunluk |
|---|---|
| Müşteri segmentasyonu | Benzer davranışlara göre gruplama için kullanılabilir. |
| Ürün gruplama | Benzer özelliklere sahip ürünleri keşfetmek için değerlendirilebilir. |
| Davranış analizi | Kullanıcıları aktivite desenlerine göre ayırmak için kullanılabilir. |
| Çok farklı şekilli kümeler | K-Means yerine farklı kümeleme yöntemleri incelenebilir. |
Sonuç
K-Means, kümeleme problemlerine giriş yapmak için güçlü bir algoritma. Temel mantık oldukça sade olsa da iyi bir analiz için yalnızca modeli çalıştırmak yeterli değil.
Doğru değişkenleri seçmek, gerekirse ölçekleme yapmak, uygun K değerini belirlemek, elbow method ve silhouette score gibi yöntemlerle sonucu incelemek ve son olarak kümeleri iş bağlamında yorumlamak gerekiyor.
“K-Means sana kümeleri verir; bu kümelerin ne anlama geldiğini söylemek ise analistin işidir.”
Özellikle müşteri segmentasyonu gibi problemlerde bu yaklaşım, ham veriyi daha anlamlı davranış gruplarına dönüştürmek için iyi bir başlangıç noktası olabilir.
Not every data set comes with predefined classes. Sometimes the goal is not to answer “Which class does this record belong to?” but to explore “Which groups form naturally inside the data?”
Clustering algorithms are built exactly for this problem, and K-Means is one of the best known and easiest to start with. It can be used for customer segmentation, product grouping, behaviour analysis and many other problems where similar observations need to be brought together.
“The goal of K-Means is not to label the data; it is to reveal the natural groups using the similarities inside it.”
What Is K-Means?
K-Means is a clustering algorithm that belongs to unsupervised learning. The core idea is to split the observations into K clusters so that the members of each cluster are similar to one another, and to update the centre of each cluster — its centroid — iteratively.
- Take the
Data - Choose
K - Initialise
Centroids - Assign
Clusters - Update
Centroids - Repeat
1. Understanding Clustering with a Simple Example
Imagine we want to group the customers of a shop by annual spending and purchase frequency, and that the data set carries no “VIP”, “standard” or “potential” label at all.
K-Means tries to form natural clusters using the similarity of customers across these two features.
High value
Customers with high spending and high purchase frequency.
Potential
Customers who buy often but with a lower average basket.
Low engagement
Customers with both low spending and low purchase frequency.
Labels come later
The algorithm does not name the clusters; the analyst interprets the groups that form.
2. What Is the K Value?
The most critical parameter of K-Means is K, which states how many clusters the data will be split into.
| K | Meaning |
|---|---|
| 2 | Split the data into 2 clusters |
| 3 | Split the data into 3 clusters |
| 4 | Split the data into 4 clusters |
| 5 | Split the data into 5 clusters |
The real question is this: how do we know the value of K? This is where methods such as the elbow method help.
3. How Does the K-Means Algorithm Work?
Step 1 — Choose the initial centroids
The algorithm picks K starting centres. At this first stage they can be chosen randomly or with a suitable initialisation method.
Step 2 — Assign every point to the nearest centre
The distance of each observation to the centroids is calculated, and the observation joins the cluster of the nearest centre.
Step 3 — Update the centroids
The new centre is calculated as the mean of the observations in each cluster.
Step 4 — Assign again
Using the new centres, the observations are assigned to clusters once more.
Step 5 — Continue until convergence
When the centres and the cluster assignments no longer change significantly, the algorithm stops.
- Centroid
- Distance
- Assignment
- New
Centroid - Check
4. Which Distance Does K-Means Use?
The most common approach in K-Means is to evaluate how far observations are from the centres using Euclidean distance. For a two-dimensional example:
The main goal of the algorithm is to keep the distances between observations and the centroid of their own cluster as small as possible.
5. What Is the Elbow Method?
The elbow method is one of the common ways to choose a suitable K. The model is run for different values of K and the within-cluster error of each solution — its inertia — is examined.
As K grows the clusters break into smaller pieces, so inertia usually falls. After a certain point, however, increasing K adds far less benefit.
6. The Elbow Method in Python
Applying K-Means with scikit-learn in Python is straightforward.
from sklearn.cluster import KMeans

inertias = []

for k in range(2, 9):
    model = KMeans(
        n_clusters=k,
        random_state=42,
        n_init="auto"
    )
    model.fit(X)
    inertias.append(model.inertia_)

# plot the inertias against the K values
Plotting the results on a line chart lets us look for the elbow-shaped break point.
7. A Real-Life Example: Customer Segmentation
Let us set up a small customer segmentation problem. Assume we have two variables for every customer:
| Variable | Description |
|---|---|
| Annual spending | The customer's total purchase amount for the year |
| Purchase frequency | The customer's number of transactions per year |
Preparing the data
import pandas as pd

df = pd.read_csv("customers.csv")

X = df[["annual_spending", "purchase_frequency"]]
Why does scaling matter?
Annual spending may range between 5,000 and 100,000 while purchase frequency ranges between 1 and 50. When the scales differ this much, the larger variable dominates the distance calculation.
from sklearn.preprocessing import StandardScaler

scaler = StandardScaler()
X_scaled = scaler.fit_transform(X)
Building the K-Means model
from sklearn.cluster import KMeans

kmeans = KMeans(
    n_clusters=3,
    random_state=42,
    n_init="auto"
)

df["cluster"] = kmeans.fit_predict(X_scaled)
We can now see which cluster each customer belongs to in the cluster column.
8. Interpreting the Clusters
Labels such as “0, 1, 2” carry no meaning on their own. It is the analyst's job to give those groups meaning by examining the average properties of each cluster.
segment_summary = df.groupby("cluster")[
    ["annual_spending", "purchase_frequency"]
].mean()

print(segment_summary)| Cluster | Spending | Frequency | Example interpretation |
|---|---|---|---|
| 0 | High | High | High-value customers |
| 1 | Medium | High | Active / potential customers |
| 2 | Low | Low | Low-engagement customers |
These segment names are not the output of the algorithm; they appear when the analyst interprets the clusters in a business context.
9. Visualising the K-Means Results
In a two-dimensional customer segmentation, seeing the clusters on a scatter plot is very useful.
import matplotlib.pyplot as plt

plt.scatter(
    X_scaled[:, 0],
    X_scaled[:, 1],
    c=df["cluster"]
)

plt.xlabel("Annual Spending")
plt.ylabel("Purchase Frequency")
plt.title("Customer Segments")
plt.show()
The visualisation makes it easier to see how well the clusters separate and why some observations sit close to a boundary.
10. Strengths and Weaknesses of K-Means
Simple and fast
The core logic is easy to grasp and it stays practical on large data sets.
Interpretable
Making sense of the segments through cluster averages is straightforward.
K must be chosen
The number of clusters is set upfront, and choosing a suitable K is a real part of the analysis.
Geometry matters
Cluster shapes and variable scales can affect the outcome of the method.
11. What to Watch Out For
Check the scale
In distance-based methods the scale of the variables affects the result directly.
Do not trust one metric
Weigh the elbow method together with the business problem and other metrics.
Use a seed
Consider the effect of different starting centres and make the result reproducible.
Extreme observations
Very extreme observations can pull the centroids noticeably.
Measure separation
Examine cluster separation separately with measures such as the silhouette score.
Turn them into segments
Translate mathematical clusters into segments that mean something in real life.
12. An Extra Check with the Silhouette Score
Alongside the elbow method, metrics such as the silhouette score can be used to evaluate clustering quality. The score helps assess how close an observation is to its own cluster and how far it is from the others.
from sklearn.metrics import silhouette_score

score = silhouette_score(
    X_scaled,
    df["cluster"]
)

print("Silhouette Score:", score)
Such metrics give supporting information when choosing K, but they do not on their own decide the number of segments the business problem needs.
13. When Should K-Means Be Used?
| Scenario | Suitability |
|---|---|
| Customer segmentation | Can be used to group customers by similar behaviour. |
| Product grouping | Worth considering to discover products with similar properties. |
| Behaviour analysis | Can be used to separate users by activity patterns. |
| Very irregular cluster shapes | Other clustering methods may fit better than K-Means. |
Conclusion
K-Means is a strong algorithm for getting into clustering problems. The core logic is quite simple, but running the model is not enough for a good analysis.
You need to choose the right variables, scale them where necessary, decide on a suitable K, examine the result with methods such as the elbow method and the silhouette score, and finally interpret the clusters in a business context.
“K-Means gives you the clusters; saying what those clusters mean is the analyst's job.”
Especially in problems such as customer segmentation, this approach is a good starting point for turning raw data into more meaningful behaviour groups.