Python ile veri görselleştirme yöntemleri
Python'da bulunan temel paketleri ile ilgili veri görselleştirme yöntemleri
- Veri Görselleştirme
- Araçlar

Python paket programında en çok kullanılan görselleştirme programlarının kod yapısı, karşılaştırılmasına yönelik yazı olacaktır.
1. Temel Kütüphaneler: Statik ve Yayın Kalitesinde Görseller
- Matplotlib, her bileşeni adım adım manuel olarak eklediğiniz emredici bir yapı sunarak grafiğin her ayrıntısı üzerinde tam kontrol sağlar.
- Seaborn: Pandas veri çerçeveleriyle doğrudan konuşan yüksek seviyeli bir yapı kullanarak, karmaşık istatistiksel grafikleri tek bir fonksiyonla estetik bir şekilde oluşturmanıza imkan tanır.
2. Modern ve Etkileşimli Kütüphaneler: Web ve Dashboard
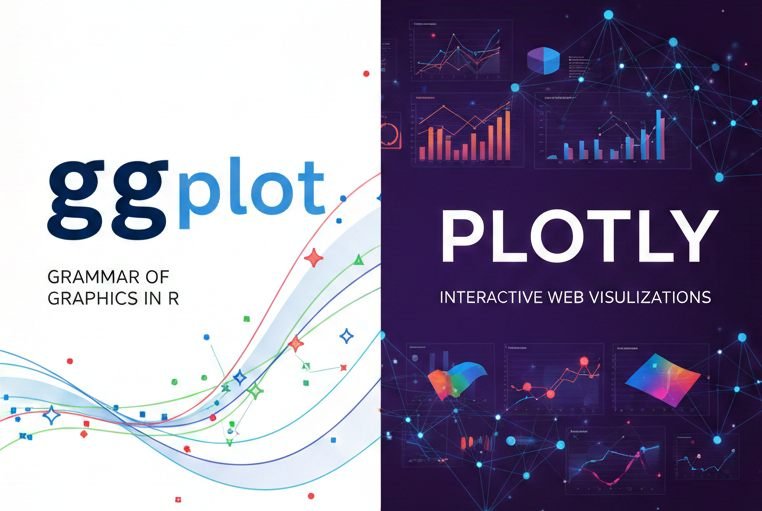
- Plotly: Modern veri biliminin "altın standardı" haline gelmiştir. Grafiklerin üzerine gelindiğinde değerlerin görünmesi, yakınlaştırma ve uzaklaştırma gibi özellikler varsayılan olarak gelir. Özellikle Plotly Express modülü, Seaborn kadar kolay bir sözdizimi sunar.
- Altair: "Grammar of Graphics" (Grafik Grameri) prensibine dayanır. Kod yazmaktan ziyade verinin neyi temsil ettiğini tanımlamaya odaklanır. Çok temiz ve deklaratif bir yapısı vardır.
Genel Olarak grafik kütüphanelerinin farkılıkları şu şekilde;
| Özellik | Matplotlib | Seaborn | Plotly | Altair |
|---|---|---|---|---|
| Tür | Statik (Ağırlıklı) | Statik / İstatistiksel | Etkileşimli | Deklaratif |
| Sözdizimi | Karmaşık (Düşük seviye) | Kolay (Yüksek seviye) | Orta (Express ile kolay) | Mantıksal / Gramer tabanlı |
| Web Entegrasyonu | Zor | Zor | Mükemmel (Dash ile) | İyi |
| Veri Yapısı | Liste, Dizi, DataFrame | Pandas DataFrame | Pandas DataFrame / JSON | Pandas DataFrame |
Kod Yapısı
Matplotlib (Nesne Yönelimli Yapı)
Matplotlib'de kod, hiyerarşik bir "katman ekleme" mantığıyla ilerler.
Temel Bileşenler:
- Tuval Hazırlama (plt.subplots()): Üzerine çizim yapılacak boş bir figür ve eksen seti oluşturulur.
- Çizim Fonksiyonu (ax.scatter()): Veri noktaları eksenlere eklenir (geometri tanımlanır).
- Düzenleme Fonksiyonları (ax.set_...()): Başlık, eksen isimleri ve lejanlar gibi statik ayarlar yapılır.
- Görüntüleme (plt.show()): Grafik ekrana basılır.
import matplotlib.pyplot as plt

fig, ax = plt.subplots() # 1. Tuval
ax.scatter(df['x'], df['y'], c='blue') # 2. Geometri
ax.set_title("Grafik Başlığı") # 3. Düzenleme
plt.show() # 4. Görüntüleme
Seaborn (Veri Odaklı Yapı)
Seaborn, görseldeki bileşenlerin çoğunu tek bir "ana fonksiyon" içinde birleştirir.
Temel Bileşenler:
- Ana Grafik Fonksiyonu (sns.scatterplot()): Veri kaynağı (data), eksenler (x, y) ve renk kategorileri (hue) tek seferde tanımlanır.
- Otomatik Düzenleme: Seaborn, sütun isimlerini kullanarak eksen etiketlerini kendisi oluşturur.
- Temalandırma (sns.set_theme()): Arka plan rengi, çizgi kalınlığı gibi estetik ayarlar genel bir fonksiyonla yapılır.
import seaborn as sns

sns.set_theme(style="whitegrid") # 1. Tema
sns.scatterplot(data=iris, x="sepal_length", y="sepal_width", hue="species")
Plotly Express (Yapılandırılmış Nesne Yapısı)
Görseldeki mantığın Python'daki en yakın karşılığıdır.
Temel Bileşenler:
- Temel Grafik Fonksiyonu (px.scatter()): Veri ve temel görsel özellikler (renk, sembol) tanımlanır.
- Düzenleme Fonksiyonları (fig.update_layout()): Paylaştığınız görseldeki layout() fonksiyonuna eşdeğerdir; başlık ve eksen ayarları burada yapılır.
- Yapılandırma Fonksiyonları (fig.update_traces()): Belirli veri gruplarına (izlere) özel stiller atanır.
- Etkileşim Ayarları (fig.show(config=...)): İndirme düğmesi ve araç çubuğu gibi interaktif özellikler belirlenir.
import plotly.express as px

fig = px.scatter(iris, x="sepal_length", y="sepal_width", color="species")
fig.update_layout(title="İris Veri Seti") # 2. Düzenleme
fig.show(config={'displayModeBar': True}) # 3. Yapılandırma
Altair (Zincirleme / Deklaratif Yapı)
Görseldeki mantığa en benzer "adım adım ekleme" yapısı Altair kütüphanesinde bulunur.
Temel Bileşenler:
- Temel Nesne (alt.Chart()): Veri kümesi tanımlanır.
- Geometri (mark_point()): Nokta, çizgi veya çubuk gibi grafik türü seçilir.
- Eşleştirme (encode()): Veri sütunları görsel kanallara (x, y, renk) bağlanır.
- Etkileşim (interactive()): Yakınlaştırma ve kaydırma özellikleri tek komutla eklenir.
import altair as alt

alt.Chart(iris).mark_point().encode( # 1 & 2. Nesne ve Geometri
    x='sepal_length', # 3. Eşleştirme
    y='sepal_width',
    color='species'
).interactive() # 4. Etkileşim
This article looks at the code structure of the most widely used visualization libraries in Python and compares them.
1. Core Libraries: Static, Publication-Quality Graphics
- Matplotlib gives you full control over every detail of a chart through an imperative structure in which you add each component manually, step by step.
- Seaborn: Built on a high-level structure that works directly with Pandas data frames, it lets you create complex statistical charts aesthetically with a single function.
2. Modern, Interactive Libraries: Web and Dashboards
- Plotly: It has become the "gold standard" of modern data science. Features such as showing values on hover and zooming in and out come by default. In particular, the Plotly Express module offers a syntax as easy as Seaborn's.
- Altair: Based on the "Grammar of Graphics" principle. Rather than writing code, it focuses on describing what the data represents. It has a very clean, declarative structure.
In general, the charting libraries differ as follows:
| Feature | Matplotlib | Seaborn | Plotly | Altair |
|---|---|---|---|---|
| Type | Static (mostly) | Static / Statistical | Interactive | Declarative |
| Syntax | Complex (low level) | Easy (high level) | Medium (easy with Express) | Logical / Grammar-based |
| Web Integration | Hard | Hard | Excellent (with Dash) | Good |
| Data Structure | List, Array, DataFrame | Pandas DataFrame | Pandas DataFrame / JSON | Pandas DataFrame |
Code Structure
Matplotlib (Object-Oriented Structure)
In Matplotlib, code follows a hierarchical "add a layer" logic.
Core Components:
- Preparing the Canvas (plt.subplots()): An empty figure and a set of axes to draw on are created.
- Plotting Function (ax.scatter()): Data points are added to the axes (the geometry is defined).
- Formatting Functions (ax.set_...()): Static settings such as the title, axis labels and legends are applied.
- Display (plt.show()): The chart is rendered on screen.
import matplotlib.pyplot as plt

fig, ax = plt.subplots() # 1. Tuval
ax.scatter(df['x'], df['y'], c='blue') # 2. Geometri
ax.set_title("Grafik Başlığı") # 3. Düzenleme
plt.show() # 4. Görüntüleme
Seaborn (Data-Oriented Structure)
Seaborn combines most of the chart's components in a single "main function".
Core Components:
- Main Plot Function (sns.scatterplot()): The data source (data), axes (x, y) and color categories (hue) are defined at once.
- Automatic Formatting: Seaborn creates the axis labels itself from the column names.
- Theming (sns.set_theme()): Aesthetic settings such as background color and line width are applied with a general function.
import seaborn as sns

sns.set_theme(style="whitegrid") # 1. Tema
sns.scatterplot(data=iris, x="sepal_length", y="sepal_width", hue="species")
Plotly Express (Structured Object Model)
It is the closest Python equivalent of the logic shown in the visual.
Core Components:
- Base Plot Function (px.scatter()): The data and basic visual properties (color, symbol) are defined.
- Formatting Functions (fig.update_layout()): Equivalent to the layout() function in the visual; title and axis settings are made here.
- Configuration Functions (fig.update_traces()): Custom styles are assigned to specific data groups (traces).
- Interaction Settings (fig.show(config=...)): Interactive features such as the download button and toolbar are set.
import plotly.express as px

fig = px.scatter(iris, x="sepal_length", y="sepal_width", color="species")
fig.update_layout(title="İris Veri Seti") # 2. Düzenleme
fig.show(config={'displayModeBar': True}) # 3. Yapılandırma
Altair (Chained / Declarative Structure)
The "step-by-step" structure closest to the logic in the visual is found in the Altair library.
Core Components:
- Base Object (alt.Chart()): The dataset is defined.
- Geometry (mark_point()): The chart type, such as point, line or bar, is selected.
- Encoding (encode()): Data columns are mapped to visual channels (x, y, color).
- Interaction (interactive()): Zooming and panning are added with a single command.
import altair as alt

alt.Chart(iris).mark_point().encode( # 1 & 2. Nesne ve Geometri
    x='sepal_length', # 3. Eşleştirme
    y='sepal_width',
    color='species'
).interactive() # 4. Etkileşim