Kısmi F Testi
Kısmi F testi, iç içe iki regresyon modelini karşılaştırarak modele eklenen değişkenlerin anlamlı katkı sağlayıp sağlamadığını gösterir.
- İstatistik

Kısmi F testi, iç içe iki regresyon modelini karşılaştırarak modele eklenen bir değişken grubunun bağımlı değişkeni açıklamada anlamlı katkı sağlayıp sağlamadığını test eder.
Tam model k bağımsız değişken, kısıtlı model ise bunların ilk q tanesini içersin. Hipotezler şöyledir:
Test istatistiği, iki modelin artık kareler toplamları arasındaki farka dayanır:
Serbestlik dereceleri:
Karar: F > F(α; k−q, n−k−1) ise H₀ reddedilir; aksi halde H₀ reddedilemez.
Aşağıdaki gösterim, q = 0 alındığında ortaya çıkan özel durumu yani genel F testini anlatır. Bu durumda hipotezler ve test istatistiği şu biçimi alır:
H0 hipotezinin reddedilmesi için x1,…,xk bağımsız değişkenlerinden en az birinin modele anlamlı katkı sağlaması gerekmektedir. Bu test basit doğrusal regresyonun genelleştirilmesidir.
H0 hipotezi doğru iken;
olacak şekilde dağılır. Ve F istatistiğinin tanımından;
oranının Fk,n-k-1 dağıldığı görülür. H0 hipotezini test etmek için Fh test değeri hesaplanır ve Fh> Fk,n-k-1 geçerli ise H0 reddedilir.
Karar Verme
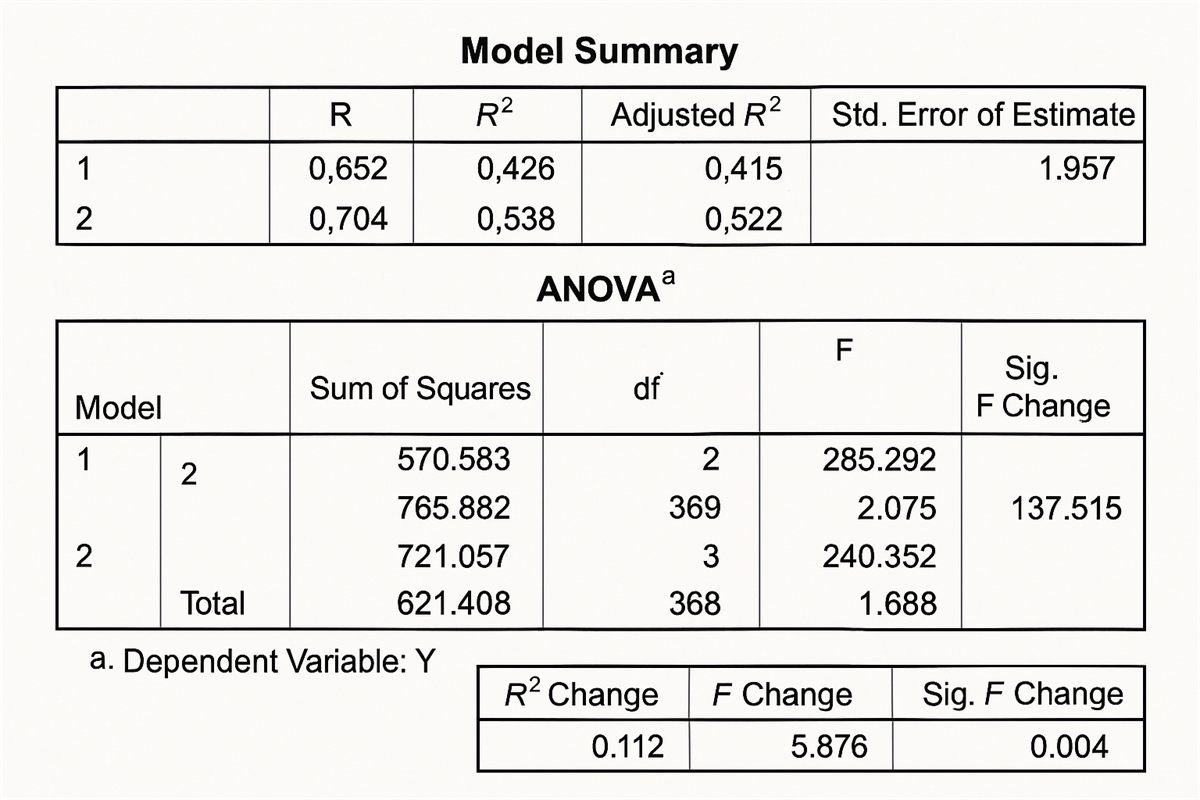
- R² Change: Eklenen değişkenlerin modeli ne kadar geliştirdiğini gösterir.
- F Change: Kısmi F testidir.
- Sig. F Change: Anlamlılık düzeyidir. <0.05 ise anlamlıdır → yeni değişkenler katkı sağlamıştır.
F değeri için karar vermek istersek, F tablosu ile karar değeri belirlenir
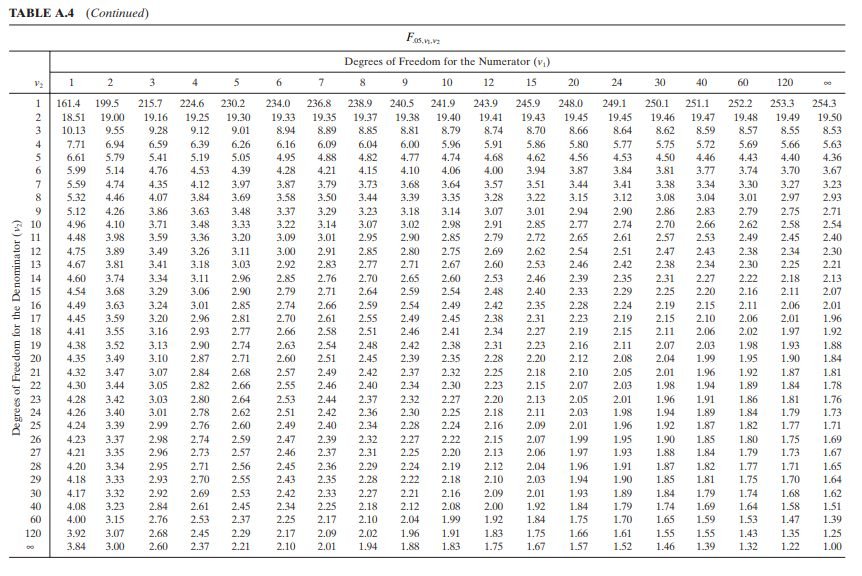
- v₁ (pay serbestlik derecesi): Genellikle eklenen değişken(ler) sayısı
- v₂ (payda serbestlik derecesi): Gözlem sayısı − toplam bağımsız değişken sayısı − 1
Hesaplanan F değeri:
- Tablodaki değerden büyükse → H₀ reddedilir (eklenen değişkenler anlamlı katkı sağlar)
- Küçükse → H₀ reddedilemez (eklenen değişkenler anlamlı değil)
The partial F-test compares two nested regression models to test whether a group of variables added to the model makes a significant contribution to explaining the dependent variable.
Let the full model contain k independent variables and the restricted model the first q of them. The hypotheses are:
The test statistic is based on the difference between the residual sums of squares of the two models:
Degrees of freedom:
Decision: if F > F(α; k−q, n−k−1), H₀ is rejected; otherwise H₀ cannot be rejected.
The notation below describes the special case where q = 0, that is the overall F-test. In that case the hypotheses and the test statistic take this form:
For H0 to be rejected, at least one of the independent variables x1,…,xk must make a significant contribution to the model. This test is a generalization of simple linear regression.
When H0 is true,
are distributed as shown. And from the definition of the F statistic,
the ratio is seen to follow Fk,n-k-1. To test H0, the test value Fh is calculated, and H0 is rejected if Fh> Fk,n-k-1.
Making a Decision
- R² Change: Shows how much the added variables improve the model.
- F Change: The partial F-test itself.
- Sig. F Change: The significance level. If <0.05, it is significant → the new variables contribute to the model.
To make a decision based on the F value, determine the critical value from the F table
- v₁ (numerator degrees of freedom): Usually the number of added variable(s)
- v₂ (denominator degrees of freedom): Number of observations − total number of independent variables − 1
Calculated F value:
- If it is greater than the table value → H₀ is rejected (the added variables make a significant contribution)
- If it is smaller → H₀ cannot be rejected (the added variables are not significant)