Belirtme Katsayısı
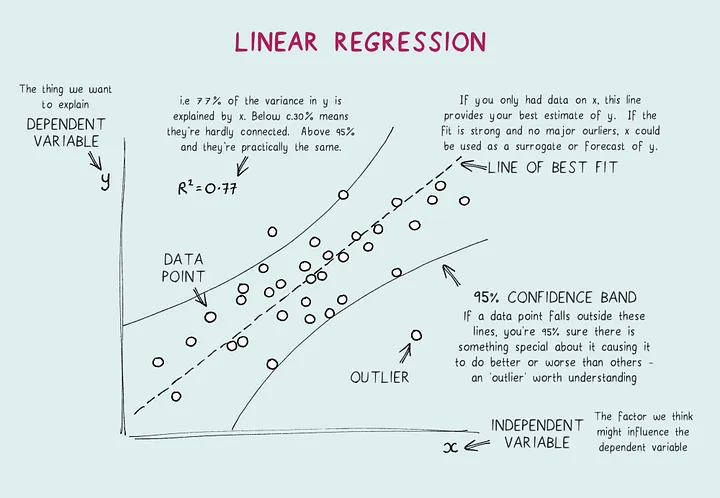
Belirtme katsayısı (R²), bir regresyon modelinde bağımsız değişkenlerin, bağımlı değişkendeki toplam değişimin ne kadarını açıkladığını gösteren ölçüdür.
- İstatistik
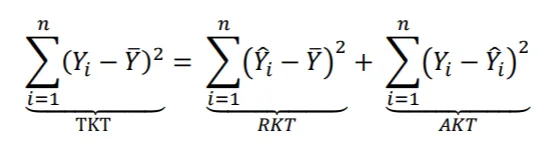
TKT:Toplam kareler Toplamı(Total Sum Of Square/SYY)
RKT:Regresyon Kareler Toplamı(Regression Sum Of Squares/SSReg)
AKT:Artıklar Kareler Toplamı(Residuals Sum Of Squares/SSRes)
Bu sonuçlara göre k tane bağımsız değişkenin doğrusal regresyon modelinde belirleme katsayısı bağımlı değişkenin % kaçını açıkladığını belirtir. Belirtme katsayısı iki bağımsız değişkenli doğrusal regresyon model için;
ile hesaplanır. Belitme katsayısının yukarıdaki eşitlik ile heplanması fazla zaman alır. Çünkü 𝑌̂ 𝑖 değerlerinin tek tek heplaması gerekir. Matris işlemleri ile 𝑌̂ 𝑖 değerininin hesaplanmasına gerek yoktur.
Bu durumda belirme katsayısı;
eşitliği şeklinde olur.
R² Değerinin Yorumlanması
| R² Değeri | Açıklama |
|---|---|
| 0 | Model bağımlı değişkeni hiç açıklamıyor. |
| 0.3 | Model verinin %30’unu açıklıyor (zayıf açıklayıcılık). |
| 0.7 | Model verinin %70’ini açıklıyor (iyi açıklayıcılık). |
| 1 | Model verinin tamamını açıklıyor (mükemmel uyum – genelde overfitting riski vardır). |
TKT: Total Sum of Squares (SYY)
RKT: Regression Sum of Squares (SSReg)
AKT: Residual Sum of Squares (SSRes)
Based on these results, the coefficient of determination of a linear regression model with k independent variables shows what percentage of the dependent variable the model explains. For a linear regression model with two independent variables, the coefficient of determination is
calculated with the formula above. Calculating it this way takes a long time, because the 𝑌̂ 𝑖 values have to be computed one by one. With matrix operations, there is no need to compute the 𝑌̂ 𝑖 values.
In this case, the coefficient of determination is
given by this equation.
Interpreting the R² Value
| R² Value | Description |
|---|---|
| 0 | The model does not explain the dependent variable at all. |
| 0.3 | The model explains 30% of the data (weak explanatory power). |
| 0.7 | The model explains 70% of the data (good explanatory power). |
| 1 | The model explains all of the data (perfect fit – usually a sign of overfitting risk). |