Normal Dağılım
Normal dağılım, ortalaması etrafında simetrik şekilde yayılan ve çan eğrisi (Gauss dağılımı) olarak bilinen sürekli bir olasılık dağılımıdır. Ortalama, medyan ve modun eşit olması temel özelliklerinden biridir. İstatistikte birçok test ve model, verilerin normal dağılıma sahip olduğu varsayımına dayanır.
- İstatistik
1. Normallik Varsayımı
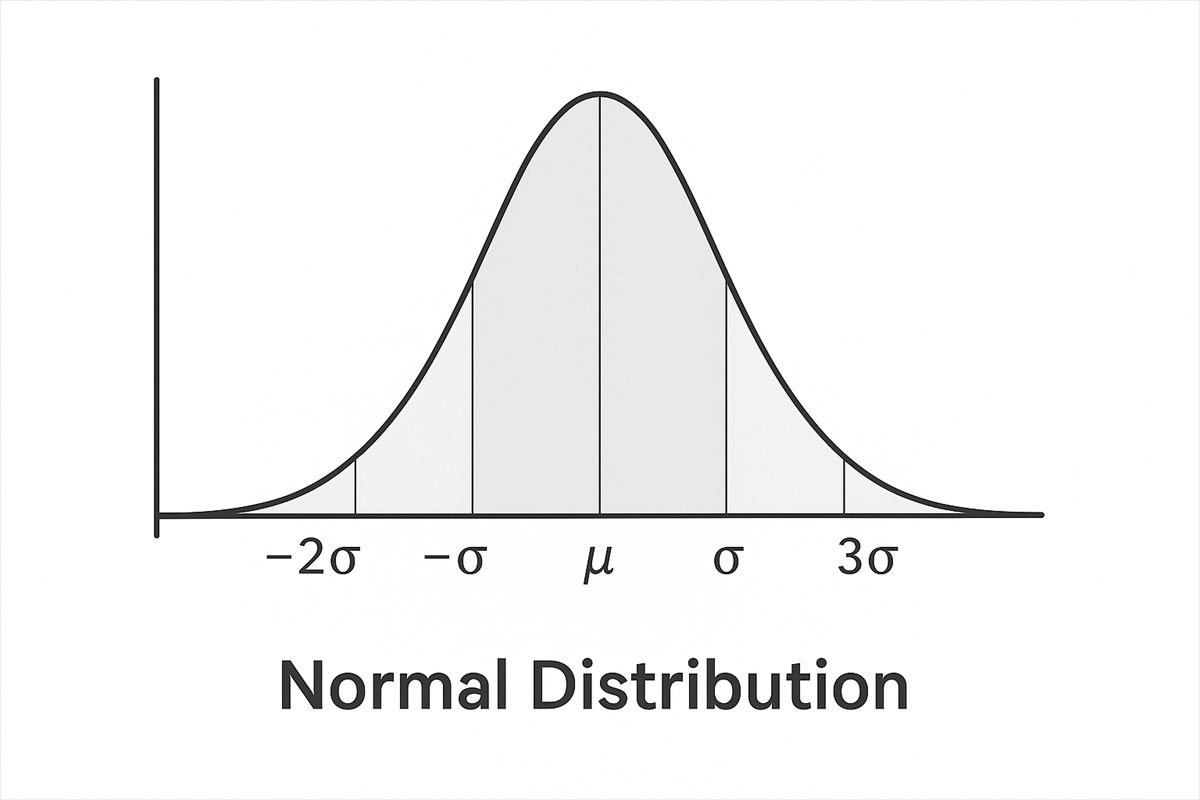
Normal dağılım, Gauss dağılımı olarak da bilinmektedir. Standart normal dağılım bir veri setinde ortalamanın 0, varyansın ise 1 olduğunu durumda sağlanmaktadır. Elimizdeki verilerin ortalamalarını çizgi grafiği ile gösterecek olursak, grafiğin orta noktasında çizginin yüksek olduğu, sağ ve sol kenarlara doğru yüksekliğin azaldığını görebiliriz. Bu yazımızın görseli bir önceki cümleyle açıklanan grafik örneğidir. Normal Dağılım Hangi Amaçla Kullanılır? Normal dağılım istatistiksel birtakım analizleri yapmadan önce uygulanan ve hangi analizi yapmamıza karar veren yardımcı bir analizdir. Örneğin iki farklı (bağımsız) grubun tek ölçüme ait ortalamalarının karşılaştırılması için bağımsız örneklem T testi veya Mann Whitney U testi kullanılabilir. Veri setimizdeki veriler normal dağılım gösteriyor ise bağımsız örneklem t testi kullanılır. Özellikle uluslararası dergilerde makale yayınlanacak ise yayın kurulları normal dağılım testi yapılıp yapılmadığına dikkat etmektedir. Ülkemizde ise yakın zamanlarda bu analizin yapılması istenilmeye başlanmıştır.
2. Çarpıklık Ve Basıklık Ölçüleri
2.1 Çarpıklık(α3)
Bir dağılıma ilişkin ölçme sonuçlarının nasıl dağıldığı hakkında bilgi verir.
- Momentlere Dayalı Çarpıklık Ölçüsü
α3=0 ise veri simetriktir
α3>0 ise veri sağa çarpık
α3<0 ise veri sola çarpık
2.2. Basıklık(α4)
Basıklık bir sınıftaki değişim miktarının göstergesidir.
- Momentlere Dayalı Çarpıklık Ölçüsü
α4=3 ise veri normaldir
α4>3 ise veri normale göre sivridir
α4<3 ise veri normale göre basıktır
3. Veri Setlerinide ki Değişkenlerin Normalliklerinin İncelenmesi
Veri setindeki değişkenlerin normallik incelemesini yapmak için iki farklı yöntem vardır. Shapiro-Wilk test istatistiği ve Kolmogorov-Smirnov test istatistiği kullanılır. Hang testin kullanılacağına gözlem sayısına göre karar verilir.
3.1. Shapiro-Wilk W Testi
Shapiro-Wilk W Testi, istatistikte bir normallik testi olarak kullanılır. Bu test, bir veri setinin normal dağılıma uyup uymadığını kontrol etmek için özellikle küçük örneklem büyüklükleri (n < 50) için güçlü bir testtir. W test istatistiği ile karşılaştırılır. Shapiro-Wilk testi aşırı duyarlıdır. Büyük örneklemlerde küçük sapmalar bile anlamlı çıkabilir.
- H0 (null) hipotezi: Veri seti normal dağılıma uygundur.
- H1 (alternatif) hipotezi: Veri seti normal dağılıma uygun değildir.
Shapiro-Wilk W istatistiğinin Formülü
Shapiro-Wilk W istatistiği şu şekilde tanımlanır:
Açıklamalar:
- : Küçükten büyüğe sıralanmış gözlem değerleri
- : Gözlemlerin aritmetik ortalaması
- : Normal dağılıma göre beklenen değerlerle ilgili özel ağırlıklar (katsayılar)
- Bu katsayılar, normal dağılıma ait beklenen sıralı istatistiklere ve kovaryans matrisine bağlıdır.
- : Örnek sayısı
- W = 1'e ne kadar yakınsa, veri o kadar normal dağılıma uygundur.
- W değeri küçükse (0'a yaklaştıkça), verinin normal dağılımdan sapması fazladır.
3.2. Kolmogorov-Smirnov (K-S) Testi
Kolmogorov-Smirnov (K-S) Testi bir veri setinin belirli bir dağılıma (genellikle normal dağılım) uyup uymadığını test eden bir normallik testidir. Ayrıca iki farklı dağılımı karşılaştırmak için de kullanılabilir. Veri dağılımı ile referans dağılım arasındaki en büyük farkı ölçer. Parametrik olmayan bir testtir (dağılım varsayımı gerekmez). Hem tek örneklem hem iki örneklem versiyonu vardır: Tek örneklem: Veri seti, belirli bir teorik dağılıma uyuyor mu? (örneğin normal dağılım) İki örneklem: İki veri seti aynı dağılımdan mı geliyor? D test istatistiği ile karşılaştırılır.
- H0 (null) hipotezi: Veri seti normal dağılıma uygundur.
- H1 (alternatif) hipotezi: Veri seti normal dağılıma uygun değildir.
Kolmogorov-Smirnov Test İstatistiği (D)
Kolmogorov-Simirnov (K-S) testinde kullanılan test istatistiği
Açıklamalar:
- : Gözlemlerden elde edilen ampirik kümülatif dağılım fonksiyonu (ECDF)
- : Karşılaştırılan teorik kümülatif dağılım fonksiyonu (örneğin, normal dağılım)
- : Her bir veri noktası için farkının maksimumu
- D değeri küçükse: Gözlem dağılımı ile teorik dağılım birbirine yakındır.
- D değeri büyükse: Gözlem dağılımı teorik dağımdan uzaklaşmaktadır.
- Elde edilen p-değeri, bu farkın istatistiksel olarak anlamlı olup olmadığını belirler.
1. The Normality Assumption
The normal distribution is also known as the Gaussian distribution. The standard normal distribution is obtained when a data set has a mean of 0 and a variance of 1. If we plot the averages of our data as a line chart, we see that the line is highest at the center of the chart and its height decreases toward the left and right edges. The image of this article is an example of the chart described in the previous sentence. What Is the Normal Distribution Used For? Normality testing is a supporting analysis carried out before certain statistical analyses, and it determines which analysis we should use. For example, to compare the means of two different (independent) groups on a single measurement, either the independent samples t-test or the Mann-Whitney U test can be used. If the data in our data set is normally distributed, the independent samples t-test is used. Editorial boards pay particular attention to whether a normality test was performed, especially when an article is to be published in an international journal. In Türkiye, this analysis has also recently started to be required.
2. Measures of Skewness and Kurtosis
2.1 Skewness (α3)
Provides information about how the measurement results of a distribution are spread.
- Moment-Based Skewness Measure
If α3=0, the data is symmetric
If α3>0, the data is right-skewed
If α3<0, the data is left-skewed
2.2. Kurtosis (α4)
Kurtosis is an indicator of the amount of variation within a class.
- Moment-Based Kurtosis Measure
If α4=3, the data is normal
If α4>3, the data is more peaked than normal
If α4<3, the data is flatter than normal
3. Examining the Normality of Variables in Data Sets
There are two different methods for examining the normality of the variables in a data set: the Shapiro-Wilk test statistic and the Kolmogorov-Smirnov test statistic. Which test to use is decided based on the number of observations.
3.1. Shapiro-Wilk W Test
The Shapiro-Wilk W test is used as a normality test in statistics. It is a powerful test for checking whether a data set follows a normal distribution, especially for small sample sizes (n < 50). It is compared with the W test statistic. The Shapiro-Wilk test is highly sensitive: in large samples, even small deviations can turn out significant.
- H0 (null) hypothesis: The data set follows a normal distribution.
- H1 (alternative) hypothesis: The data set does not follow a normal distribution.
Formula of the Shapiro-Wilk W Statistic
The Shapiro-Wilk W statistic is defined as follows:
Notes:
- : Observation values sorted in ascending order
- : Arithmetic mean of the observations
- : Special weights (coefficients) related to the expected values under a normal distribution
- These coefficients depend on the expected order statistics of the normal distribution and their covariance matrix.
- : Sample size
- The closer W is to 1, the more closely the data follows a normal distribution.
- If W is small (closer to 0), the data deviates strongly from a normal distribution.
3.2. Kolmogorov-Smirnov (K-S) Test
The Kolmogorov-Smirnov (K-S) test is a normality test that checks whether a data set follows a particular distribution (usually the normal distribution). It can also be used to compare two different distributions. It measures the largest difference between the data distribution and the reference distribution. It is a non-parametric test (no distributional assumption is required). It has both one-sample and two-sample versions: One-sample: Does the data set follow a particular theoretical distribution? (e.g. the normal distribution) Two-sample: Do two data sets come from the same distribution? It is compared with the D test statistic.
- H0 (null) hypothesis: The data set follows a normal distribution.
- H1 (alternative) hypothesis: The data set does not follow a normal distribution.
Kolmogorov-Smirnov Test Statistic (D)
The test statistic used in the Kolmogorov-Smirnov (K-S) test
Notes:
- : Built from the observations, the empirical cumulative distribution function (ECDF)
- : The theoretical cumulative distribution function it is compared with (e.g. the normal distribution)
- : Over all data points, the difference at its maximum
- If D is small: the observed distribution is close to the theoretical distribution.
- If D is large: the observed distribution departs from the theoretical distribution.
- The resulting p-value determines whether this difference is statistically significant.