DAX Nedir? Power BI İçin En Önemli DAX Formülleri
Power BI'da ölçüler, hesaplanan sütunlar, filtre bağlamı ve zaman bazlı analizler için en önemli DAX fonksiyonlarını gerçek örneklerle inceliyorum.
- Araçlar
- Veri Görselleştirme
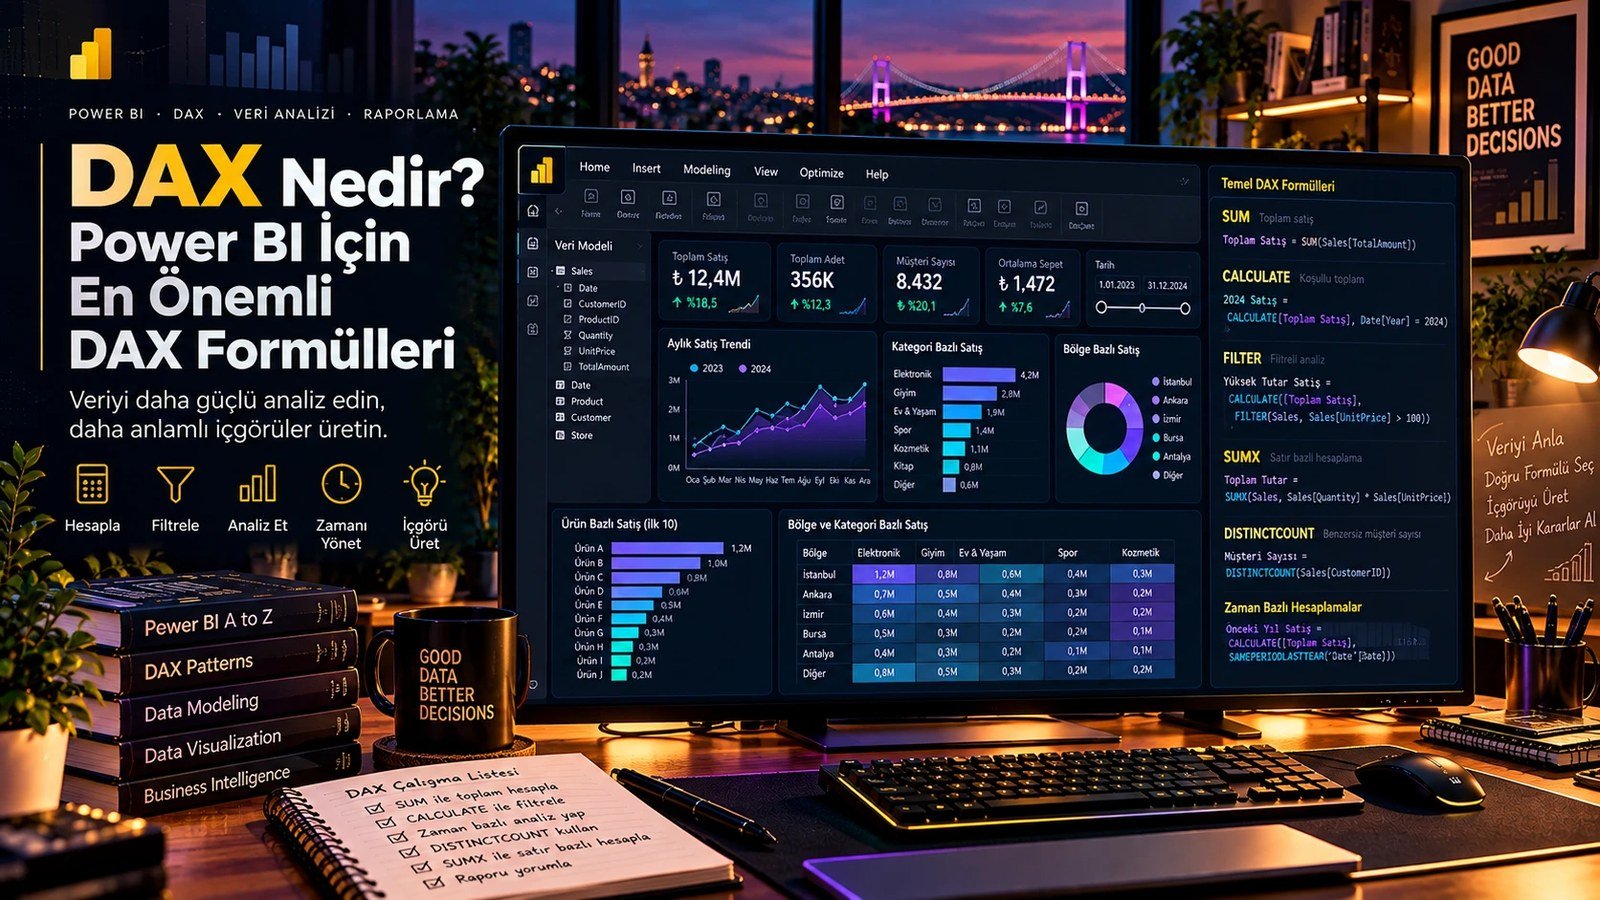
Power BI ile dashboard hazırlarken grafiklerin arkasında çalışan hesaplama dili çoğu zaman DAX'tır. DAX, yani Data Analysis Expressions, verileri filtre bağlamına göre analiz etmek, ölçüler oluşturmak ve daha gelişmiş hesaplamalar yapmak için kullanılan ifade dilidir.
DAX öğrenmeye başlarken yüzlerce fonksiyonu ezberlemek yerine, measure ile calculated column arasındaki farkı ve SUM, CALCULATE, FILTER, SUMX, DISTINCTCOUNT gibi temel yapıların mantığını anlamak çok daha değerli.
“DAX'ın gücü sadece matematiksel işlem yapmakta değil, sonucu bulunduğu filtre bağlamına göre yeniden hesaplayabilmesinde.”
DAX Nedir?
DAX, Power BI başta olmak üzere Microsoft'un analitik araçlarında kullanılan bir formül dilidir. Basit toplamların yanında filtrelenmiş toplamlar, müşteri sayıları, büyüme oranları, dönem karşılaştırmaları ve daha gelişmiş iş metrikleri oluşturmak için kullanılır.
- Veri
Modeli - Measure
- Filtre
Bağlamı - Hesaplama
- KPI
Measure ve Calculated Column Arasındaki Fark
DAX öğrenirken ilk anlaşılması gereken konulardan biri measure ile calculated column arasındaki fark. İkisi de DAX kullanır; ancak çalışma biçimleri ve kullanım amaçları farklıdır.
| Özellik | Measure | Calculated column |
|---|---|---|
| Hesaplama zamanı | Görsel sorgulandığında | Veri yenilenirken |
| Sonuç | Filtre bağlamına göre değişebilir | Her satır için değer üretir |
| Kullanım | KPI, toplam, oran, trend | Yeni kategori / satır bazlı alan |
| Örnek | Toplam satış | Satış seviyesi |
1. SUM — Toplam Hesaplamak
DAX öğrenmeye başlanabilecek en temel fonksiyonlardan biri SUM. Örneğin toplam satış için:
Toplam Satis =
SUM(Satis[NetSatis])
Bu measure bir karta, tabloya veya grafiğe eklendiğinde bulunduğu filtre bağlamına göre toplam satışı hesaplar.
2. DISTINCTCOUNT — Benzersiz Değerleri Saymak
Toplam kayıt sayısı ile benzersiz müşteri sayısı aynı şey değildir. Benzersiz müşterileri hesaplamak için DISTINCTCOUNT kullanılabilir.
Musteri Sayisi =
DISTINCTCOUNT(Satis[MusteriID])
Bu measure ile “Kaç farklı müşterimiz var?” sorusuna cevap verebiliriz.
3. CALCULATE — DAX'ın En Önemli Fonksiyonlarından Biri
CALCULATE, mevcut filtre bağlamını değiştirerek bir ifadenin yeniden değerlendirilmesini sağlar. DAX'ın en güçlü ve en sık kullanılan yapı taşlarından biri olmasının temel nedeni bu.
Elektronik Satis =
CALCULATE(
    [Toplam Satis],
    Urun[Kategori] = "Elektronik"
)
Burada önce daha önce oluşturduğumuz [Toplam Satis] measure'ını alıyoruz, ardından hesaplama bağlamını “Elektronik” kategorisiyle değiştiriyoruz.
Bağlamı değiştirir
Bir ölçüyü farklı filtre koşullarında yeniden hesaplamayı sağlar.
Karşılaştırma kurar
Toplam, kategori, dönem veya segment bazlı analizleri kolaylaştırır.
4. FILTER — Daha Kontrollü Filtreler
FILTER, özellikle karmaşık koşullar söz konusu olduğunda satır bazında bir filtre tablosu oluşturmak için kullanılır.
Yuksek Satis =
CALCULATE(
    [Toplam Satis],
    FILTER(
        Satis,
        Satis[NetSatis] > 10000
    )
)
Burada 10.000'in üzerindeki satış kayıtlarını filtreleyerek toplamı hesaplıyoruz.
FILTER güçlüdür; ancak her durumda gerekli değildir. Basit filtreler için CALCULATE içinde doğrudan kolon koşulları daha sade bir yaklaşım olabilir.5. SUMX — Satır Satır Hesaplama
SUM doğrudan bir sütunu toplarken, SUMX bir tablo üzerinde satır satır bir ifade hesaplayıp sonuçları toplar.
Toplam Ciro =
SUMX(
    Satis,
    Satis[Adet] * Satis[BirimFiyat]
)
Örneğin veri setinde hazır bir “NetSatış” sütunu bulunmuyorsa, adet ile birim fiyatı her satır için çarpıp toplamını alabiliriz.
6. CASE WHEN'in DAX Karşılığı: IF ve SWITCH
DAX'ta SQL'deki CASE WHEN mantığı için çoğunlukla IF, daha fazla seçenek olduğunda ise SWITCH kullanılır.
Satis Seviyesi =
IF(
    [Toplam Satis] >= 100000,
    "Yüksek",
    "Normal"
)

-- Birden fazla seçenek için
Satis Seviyesi =
SWITCH(
    TRUE(),
    [Toplam Satis] >= 100000, "Yüksek",
    [Toplam Satis] >= 50000, "Orta",
    "Düşük"
)
7. Zaman Bazlı Hesaplamalar
Power BI dashboard'larında en sık ihtiyaç duyulan analizlerden biri dönem karşılaştırması. Bunun için tarih tablosunun düzgün kurulması ve DAX'ın zaman fonksiyonlarının doğru kullanılması önemli.
Yıl içinden bugüne: DATESYTD
YTD Satis =
CALCULATE(
    [Toplam Satis],
    DATESYTD(Takvim[Tarih])
)
Önceki yıl: SAMEPERIODLASTYEAR
Gecen Yil Satis =
CALCULATE(
    [Toplam Satis],
    SAMEPERIODLASTYEAR(Takvim[Tarih])
)
Yıllık değişim oranı
Yillik Buyume =
DIVIDE(
    [Toplam Satis] - [Gecen Yil Satis],
    [Gecen Yil Satis]
)
Bu üç measure birlikte kullanıldığında satışların hem mevcut dönemdeki seviyesini hem de önceki yıla göre değişimini dashboard üzerinde gösterebiliriz.
8. DIVIDE — Oranları Daha Güvenli Hesaplamak
DAX'ta oran hesaplamak için DIVIDE kullanmak, doğrudan bölme işlemine göre daha kontrollü bir yaklaşım.
Donusum Orani =
DIVIDE(
    [Siparis Sayisi],
    [Ziyaret Sayisi]
)
DIVIDE paydanın sıfır olduğu durumları yönetmek için kullanılabilir ve isteğe bağlı olarak alternatif bir sonuç değeri de alabilir.
9. Filtre Bağlamını Anlamak
DAX öğrenirken en kritik kavramlardan biri filtre bağlamı (filter context). Aynı measure bir kartta toplamı gösterirken, bir grafik üzerinde kategori veya tarih filtresine göre farklı sonuçlar üretebilir.
- Toplam
Satış - Yıl =
2025 - Kategori =
Elektronik - Bölge =
İstanbul
Bu yüzden DAX'ı yalnızca “formül dili” olarak değil, filtre bağlamında hesaplama dili olarak düşünmek çok daha faydalı.
10. İyi Bir DAX Measure Nasıl Yazılır?
Anlamlı isimler
[Toplam Satis] gibi ne yaptığı açık isimler kullan.
Yeniden kullan
Aynı hesabı farklı measure'larda tekrar etmek yerine temel bir measure oluştur.
Basit başla
Önce temel measure'ı oluştur, ihtiyaç oldukça genişlet.
Filtreyi düşün
Measure'ın farklı görsellerde hangi bağlamda çalışacağını kontrol et.
Maliyeti izle
Gereksiz karmaşık hesaplamalardan kaçın.
Sonucu kontrol et
DAX sonucunu bağımsız bir hesapla veya kaynak veriyle karşılaştır.
En Çok Kullanılan DAX Fonksiyonları
| Fonksiyon | Temel kullanım | Örnek ihtiyaç |
|---|---|---|
SUM() | Toplama | Toplam satış |
CALCULATE() | Filtre bağlamını değiştirme | Kategori / dönem bazlı ölçü |
FILTER() | Tabloyu koşula göre filtreleme | Karmaşık filtreler |
SUMX() | Satır bazlı ifade + toplama | Adet × fiyat |
DISTINCTCOUNT() | Benzersiz sayım | Müşteri sayısı |
DIVIDE() | Bölme | Oran ve yüzde |
DATESYTD() | YTD hesaplama | Yıl içi satış |
SAMEPERIODLASTYEAR() | Önceki yıl dönemi | Yıllık karşılaştırma |
IF() / SWITCH() | Koşullu mantık | Segment / sınıflandırma |
Mini Bir DAX Analiz Seti
Aşağıdaki measure'lar, basit bir satış dashboard'ı için iyi bir başlangıç oluşturur:
Toplam Satis =
SUM(Satis[NetSatis])

Musteri Sayisi =
DISTINCTCOUNT(Satis[MusteriID])

YTD Satis =
CALCULATE(
    [Toplam Satis],
    DATESYTD(Takvim[Tarih])
)

Gecen Yil Satis =
CALCULATE(
    [Toplam Satis],
    SAMEPERIODLASTYEAR(Takvim[Tarih])
)

Yillik Buyume =
DIVIDE(
    [Toplam Satis] - [Gecen Yil Satis],
    [Gecen Yil Satis]
)
Bu birkaç measure ile bile toplam satış, müşteri sayısı, YTD performansı ve yıllık büyüme gibi temel KPI'lar oluşturulabilir.
Sonuç
DAX, Power BI'da yalnızca birkaç toplama formülünden ibaret değil. Özellikle measure mantığını, filtre bağlamını ve CALCULATE gibi temel fonksiyonların nasıl çalıştığını anlamaya başladığınızda çok daha gelişmiş analizler oluşturabilirsiniz.
Başlangıç için SUM, DISTINCTCOUNT, CALCULATE, FILTER, SUMX, DIVIDE ve zaman bazlı fonksiyonları öğrenmek güçlü bir temel sağlar. Sonrasında daha gelişmiş DAX fonksiyonlarına geçmek çok daha kolay hale gelir.
“İyi bir DAX formülü sadece doğru sonucu üretmez; farklı filtrelerde de neden o sonucu verdiğini anlayabileceğiniz kadar açık bir mantığa sahiptir.”
When you build a dashboard in Power BI, the calculation language running behind the visuals is usually DAX. DAX, short for Data Analysis Expressions, is the expression language used to analyse data according to filter context, create measures and build more advanced calculations.
Rather than memorising hundreds of functions, it is far more valuable to understand the difference between a measure and a calculated column and the logic of core structures such as SUM, CALCULATE, FILTER, SUMX and DISTINCTCOUNT.
“The power of DAX is not only in doing arithmetic, but in being able to recalculate the result according to the filter context it sits in.”
What Is DAX?
DAX is a formula language used in Microsoft's analytics tools, Power BI first among them. Beyond simple totals, it is used to build filtered totals, customer counts, growth rates, period comparisons and more advanced business metrics.
- Data
Model - Measure
- Filter
Context - Calculation
- KPI
Measure vs Calculated Column
One of the first things to understand in DAX is the difference between a measure and a calculated column. Both use DAX, but they work differently and serve different purposes.
| Property | Measure | Calculated column |
|---|---|---|
| When it is calculated | When the visual is queried | When the data is refreshed |
| Result | Can change with the filter context | Produces a value for every row |
| Usage | KPI, total, ratio, trend | New category / row-level field |
| Example | Total sales | Sales level |
1. SUM — Calculating a Total
SUM is one of the most basic functions to start with. For total sales, for example:
Total Sales =
SUM(Sales[NetSales])
When this measure is added to a card, a table or a chart, it calculates total sales according to the filter context it is in.
2. DISTINCTCOUNT — Counting Unique Values
The total number of records and the number of unique customers are not the same thing. DISTINCTCOUNT can be used to count unique customers.
Customer Count =
DISTINCTCOUNT(Sales[CustomerID])
With this measure we can answer “How many different customers do we have?”.
3. CALCULATE — One of the Most Important DAX Functions
CALCULATE re-evaluates an expression by changing the current filter context. That is the main reason it is one of the most powerful and most frequently used building blocks in DAX.
Electronics Sales =
CALCULATE(
    [Total Sales],
    Product[Category] = "Electronics"
)
Here we take the [Total Sales] measure created earlier and then change the calculation context with the “Electronics” category.
Changes the context
Lets you recalculate a measure under different filter conditions.
Builds comparisons
Makes total, category, period or segment based analyses easier.
4. FILTER — More Controlled Filters
FILTER is used to build a row-level filter table, especially when the conditions get complex.
High Sales =
CALCULATE(
    [Total Sales],
    FILTER(
        Sales,
        Sales[NetSales] > 10000
    )
)
Here we filter the sales records above 10,000 and calculate the total from them.
FILTER is powerful, but it is not always needed. For simple filters, column conditions written directly inside CALCULATE can be the cleaner approach.5. SUMX — Row-by-Row Calculation
While SUM adds up a column directly, SUMX evaluates an expression row by row over a table and then sums the results.
Total Revenue =
SUMX(
    Sales,
    Sales[Quantity] * Sales[UnitPrice]
)
If the data set has no ready-made “net sales” column, for example, we can multiply quantity by unit price for each row and take the total.
6. The DAX Equivalent of CASE WHEN: IF and SWITCH
For the CASE WHEN logic of SQL, DAX mostly uses IF, or SWITCH when there are more options.
Sales Level =
IF(
    [Total Sales] >= 100000,
    "High",
    "Normal"
)

-- For more than one option
Sales Level =
SWITCH(
    TRUE(),
    [Total Sales] >= 100000, "High",
    [Total Sales] >= 50000, "Medium",
    "Low"
)
7. Time-Based Calculations
Period comparison is one of the most requested analyses in Power BI dashboards. It needs a properly built date table and the correct use of DAX time intelligence functions.
Year to date: DATESYTD
YTD Sales =
CALCULATE(
    [Total Sales],
    DATESYTD(Calendar[Date])
)
Previous year: SAMEPERIODLASTYEAR
Last Year Sales =
CALCULATE(
    [Total Sales],
    SAMEPERIODLASTYEAR(Calendar[Date])
)
Year-over-year change
Annual Growth =
DIVIDE(
    [Total Sales] - [Last Year Sales],
    [Last Year Sales]
)
Used together, these three measures show both the current level of sales and the change against the previous year on a dashboard.
8. DIVIDE — Calculating Ratios More Safely
Using DIVIDE for ratios in DAX is a more controlled approach than a direct division.
Conversion Rate =
DIVIDE(
    [Order Count],
    [Visit Count]
)
DIVIDE can handle the cases where the denominator is zero, and it optionally takes an alternative result value.
9. Understanding Filter Context
One of the most critical concepts in DAX is filter context. The same measure can show a grand total on a card and produce different results on a chart according to the category or date filter.
- Total
Sales - Year =
2025 - Category =
Electronics - Region =
Istanbul
That is why it helps to think of DAX not only as a “formula language” but as a language that calculates within a filter context.
10. How to Write a Good DAX Measure
Meaningful names
Use names such as [Total Sales] that make the purpose obvious.
Build on base measures
Instead of repeating the same calculation, create one base measure and reuse it.
Start simple
Create the base measure first and extend it as the need appears.
Think about filters
Check which context the measure will run in across different visuals.
Watch the cost
Avoid unnecessarily complex calculations.
Check the result
Compare the DAX output with an independent calculation or the source data.
The Most Used DAX Functions
| Function | Main use | Example need |
|---|---|---|
SUM() | Summing | Total sales |
CALCULATE() | Changing the filter context | Category / period based measure |
FILTER() | Filtering a table by a condition | Complex filters |
SUMX() | Row-level expression + sum | Quantity × price |
DISTINCTCOUNT() | Unique count | Customer count |
DIVIDE() | Division | Ratios and percentages |
DATESYTD() | YTD calculation | Sales within the year |
SAMEPERIODLASTYEAR() | The same period last year | Year-over-year comparison |
IF() / SWITCH() | Conditional logic | Segmentation / classification |
A Mini DAX Analysis Set
The measures below make a good starting point for a simple sales dashboard:
Total Sales =
SUM(Sales[NetSales])

Customer Count =
DISTINCTCOUNT(Sales[CustomerID])

YTD Sales =
CALCULATE(
    [Total Sales],
    DATESYTD(Calendar[Date])
)

Last Year Sales =
CALCULATE(
    [Total Sales],
    SAMEPERIODLASTYEAR(Calendar[Date])
)

Annual Growth =
DIVIDE(
    [Total Sales] - [Last Year Sales],
    [Last Year Sales]
)
Even these few measures are enough to build core KPIs such as total sales, customer count, YTD performance and annual growth.
Conclusion
DAX in Power BI is much more than a handful of summing formulas. Once you start to understand the logic of measures, filter context and how core functions such as CALCULATE work, you can build far more advanced analyses.
Learning SUM, DISTINCTCOUNT, CALCULATE, FILTER, SUMX, DIVIDE and the time intelligence functions gives a strong foundation to start from. Moving on to more advanced DAX functions becomes much easier afterwards.
“A good DAX formula does not only produce the right result; its logic is clear enough that you can see why it gives that result under different filters.”