
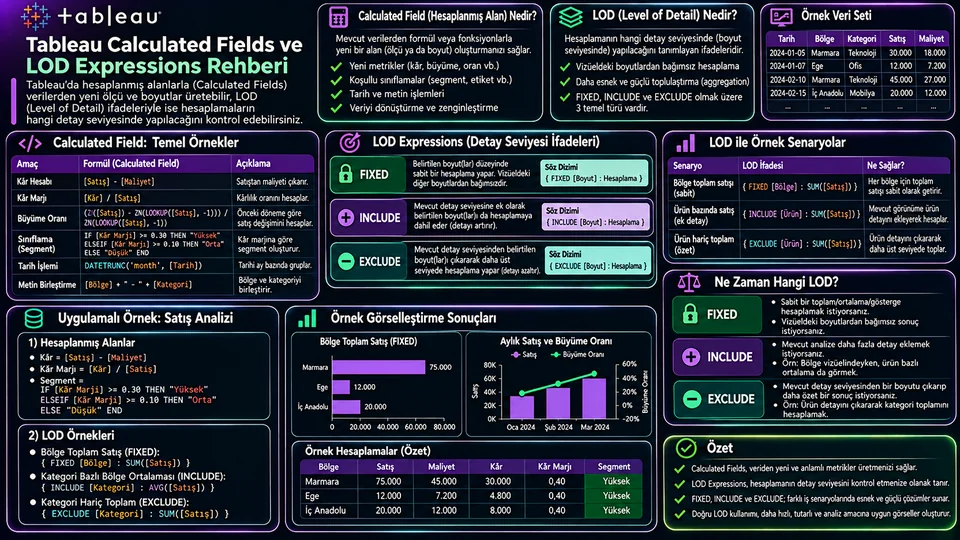
Tableau Calculated Fields ve LOD Expressions Rehberi
Tableau'da sayı neden yanlış çıkar? Satır düzeyi ve toplulaştırılmış hesapların farkından FIXED, INCLUDE ve EXCLUDE ifadelerine; filtre işlem sırasının neden her şeyi değiştirdiğine kadar.
- Araçlar
- Veri Görselleştirme
Hesaplanmış alan nedir?
Calculated Field, veri kaynağındaki alanları, sabitleri ve Tableau fonksiyonlarını bir ifadede birleştirerek yeni bir değer üretir. Kâr marjı, sipariş segmenti, tarih grubu veya müşteri başına toplam satış gibi metrikler bu yolla tanımlanır.
Önemli olan şu: hesaplanmış alan kaynak veriyi değiştirmez; yalnızca analizde kullanılabilecek yeni bir alan tanımlar. Sonucu belirleyen üç şey vardır — hesaplamanın hangi ayrıntı seviyesinde çalıştığı, hangi filtrelerden etkilendiği ve görselde nasıl toplulaştırıldığı. Tableau'da karşılaşılan "sayı neden yanlış?" sorularının büyük çoğunluğu bu üç başlıktan birine dayanır.
Sales, Profit, Quantity, Customer Name, Category, Region ve Order Date alanlarının bulunduğunu varsayıyoruz.Alan oluşturma ve satır düzeyi hesaplar
Tableau'da Analysis → Create Calculated Field yolunu izleyin, alana bir ad verin, formülü yazın ve alt kısımdaki doğrulama mesajını kontrol edin. Formül kabul edildiğinde alan, Data panelinde ölçü (measure) veya boyut (dimension) olarak görünür.
// Satır başına indirim tutarı
[Sales] * [Discount]

// Koşullu sipariş etiketi
IF [Sales] >= 1000 THEN "Yüksek"
ELSEIF [Sales] >= 250 THEN "Orta"
ELSE "Standart"
END

// Sipariş yılı
YEAR([Order Date])
Bu ifadelerin hepsi her veri satırı için ayrı ayrı hesaplanır. Görsele sürüklediğinizde Tableau bunları otomatik olarak toplulaştırır — sayısal bir alan ise varsayılan olarak SUM alır. Bu otomatik toplulaştırma, bir sonraki bölümdeki en yaygın hatanın kaynağıdır.
Dört hesaplama türü
| Tür | Örnek | Hangi seviyede hesaplanır? |
|---|---|---|
| Satır düzeyi | [Sales] * [Discount] | Her kayıt için ayrı |
| Toplulaştırılmış | SUM([Profit]) / SUM([Sales]) | Görseldeki gruplara göre |
| LOD ifadesi | { FIXED [Customer Name] : SUM([Sales]) } | İfadede belirtilen boyutlara göre |
| Table Calculation | RUNNING_SUM(SUM([Sales])) | Görselin hücre düzenine göre |
Aradaki farkı en iyi gösteren örnek oran hesabıdır. Kâr marjını iki şekilde yazabilirsiniz ve sonuçlar farklıdır:
// DOĞRU: önce topla, sonra böl
IF SUM([Sales]) = 0 THEN NULL
ELSE SUM([Profit]) / SUM([Sales])
END

// YANLIŞ (çoğu durumda): satır oranlarının ortalaması
AVG([Profit] / [Sales])
İkincisi, 10 TL'lik bir siparişle 10.000 TL'lik bir siparişi eşit ağırlıkta sayar. Genel kâr marjı sormuşsanız doğru cevap birincisidir. Bu ayrım ("oranların ortalaması" ile "toplamların oranı") Tableau'ya özgü değildir ama Tableau'da fark etmesi daha zordur, çünkü her iki formül de hatasız çalışır.
LOD ifadeleri ne işe yarar?
Normalde bir hesaplama, görseldeki boyutların belirlediği ayrıntı seviyesinde çalışır. Görselde Region varsa bölge bazında, Region + Category varsa bölge-kategori bazında. LOD (Level of Detail) ifadeleri bu bağımlılığı kırar: hesaplamanın hangi seviyede yapılacağını siz yazarsınız.
{ FIXED | INCLUDE | EXCLUDE [Boyut(lar)] : TOPLULAŞTIRILMIŞ İFADE }Süslü parantezler ifadeyi sınırlar, iki nokta boyut listesini toplulaştırmadan ayırır.
Üçünün kısa tanımı: FIXED seviyeyi belirttiğiniz boyutlara sabitler, görseli hiç dikkate almaz. INCLUDE görseldeki boyutlara bir tane daha ekler. EXCLUDE görselde bulunan bir boyutu hesaplamanın dışında bırakır.
FIXED: görselden bağımsız sabit seviye
En çok kullanılan LOD türü FIXED'dir. Tipik kullanım alanı, görselin ayrıntı seviyesinden bağımsız bir "müşteri toplamı" veya "genel toplam" üretmektir.
// Her müşterinin toplam satışı
{ FIXED [Customer Name] : SUM([Sales]) }

// Tüm veri kümesindeki satış toplamı (boyut yok)
{ FIXED : SUM([Sales]) }

// Müşterinin ilk sipariş tarihi — kohort analizinin temeli
{ FIXED [Customer Name] : MIN([Order Date]) }
Üçüncü örnek pratikte çok işe yarar. Müşterinin ilk sipariş tarihini sabitledikten sonra, "ilk siparişinden bu yana kaç ay geçti" gibi bir alan tanımlayıp kohort grafikleri kurabilirsiniz. Görselde hangi boyutlar olursa olsun, ilk sipariş tarihi değişmez.
FIXED ve filtreler
FIXED'in en kafa karıştırıcı yanı filtre davranışıdır. Tableau'nun işlem sırasında FIXED, boyut filtrelerinden önce hesaplanır. Yani kenar çubuğundan "sadece Batı bölgesi" filtresi uyguladığınızda, FIXED hesabı hâlâ tüm bölgeleri içerir.
Bunu istemiyorsanız filtreyi context filter'a dönüştürmeniz gerekir (filtreye sağ tık → Add to Context). Context filtreler FIXED'den önce uygulanır ve sonucu etkiler. Bu, "filtreyi değiştirdim ama sayı değişmedi" şikâyetinin birinci sebebidir.
INCLUDE: görsele ayrıntı eklemek
INCLUDE, görseldeki boyutları korur ve hesaplama için bir tane daha ekler. En tipik kullanımı "alt seviyede hesapla, üst seviyede ortala" kalıbıdır.
AVG(
  { INCLUDE [Customer Name] : SUM([Sales]) }
)
Bu ifade iki aşamada çalışır. İçeride, görseldeki boyutlara Customer Name eklenerek her müşteri-kategori kombinasyonu için satış toplamı hesaplanır. Dışarıdaki AVG ise bu toplamların görsel seviyesindeki ortalamasını alır. Görselde yalnızca Category varsa sonuç şu olur: "bu kategoride ortalama bir müşteri ne kadar harcıyor?"
Bunu LOD olmadan yapmak kolay değildir. AVG([Sales]) yazarsanız satır ortalamasını alırsınız — yani ortalama sipariş satırı tutarını, ortalama müşteri harcamasını değil. İkisi tamamen farklı sorulardır.
INCLUDE, FIXED'in aksine boyut filtrelerinden sonra değerlendirilir. Yani kenar çubuğu filtreleri hesaba dâhil edilen kayıtları etkiler. Çoğu zaman istediğiniz davranış budur.
EXCLUDE: görselden boyut çıkarmak
EXCLUDE, görselde bulunan bir boyutu hesaplamanın dışında bırakır. En yaygın kullanımı "parçanın bütüne oranı" hesaplarıdır.
// Görselde Region ve Category varken
SUM([Sales]) /
ATTR(
  { EXCLUDE [Category] : SUM([Sales]) }
)
Pay, o hücredeki kategori satışıdır. Payda ise aynı bölgenin bütün kategorileri toplamıdır — çünkü Category hesaptan çıkarılmıştır. Sonuç, kategorinin bölge içindeki payını verir.
Buradaki ATTR sarmalayıcısı şart: EXCLUDE sonucu, görselin her satırında aynı değeri tekrarladığı için Tableau bir toplulaştırma bekler. ATTR, "bu grup içindeki tüm değerler aynıysa o değeri döndür" anlamına gelir ve bu durumda doğru seçimdir.
Üçünü yan yana koyalım
| LOD | Seviye nasıl belirlenir? | Tipik kullanım | Boyut filtresi etkisi |
|---|---|---|---|
| FIXED | Yalnızca yazdığınız boyutlar | Müşteri toplamı, ilk sipariş tarihi, genel payda | Context değilse etkilenmez |
| INCLUDE | Görsel boyutları + eklenen boyut | Alt seviyede hesapla, üstte ortala | LOD'dan önce uygulanır, etkiler |
| EXCLUDE | Görsel boyutları − çıkarılan boyut | Toplam içindeki pay, bölge alt toplamı | LOD'dan önce uygulanır, etkiler |
Tableau'nun işlem sırası kabaca şöyledir ve beklenmedik sonuçlarda buraya dönmek gerekir:
- Extract
Filtresi - Veri Kaynağı
Filtresi - Context
Filtresi - FIXED
- Boyut
Filtreleri - INCLUDE
EXCLUDE
Hangi hesaplamayı seçmeli?
- Her satır için yeni bir değer mi üretiyorsunuz? Temel calculated field yeterli.
- Görselin mevcut gruplarında toplam veya oran mı istiyorsunuz? Toplulaştırılmış hesap kullanın.
- Görselden bağımsız sabit bir seviye mi gerekiyor? FIXED düşünün.
- Alt bir boyutta hesaplayıp üstte ortalamak mı istiyorsunuz? INCLUDE.
- Görseldeki bir boyutu paydadan çıkaracak mısınız? EXCLUDE.
- Komşu hücrelere göre kümülatif, fark veya sıralama mı? Table calculation.
Son maddeyi özellikle vurgulamak istiyorum: yalnızca mevcut görselde yüzde toplam veya running total istiyorsanız, table calculation genellikle LOD'dan daha basit ve daha hızlıdır. LOD'u, veri sorgusu aşamasında farklı bir seviyeye gerçekten ihtiyacınız olduğunda kullanın.
Sık yapılan hatalar
Tekrarlanan LOD'u toplamak
FIXED değerleri markta tekrarlanır; SUM ile toplamak sonucu şişirir. AVG, MIN veya ATTR düşünün.
FIXED'in filtreyi atlaması
Kenar çubuğu filtresi FIXED'i etkilemez. Etkilemesini istiyorsanız context filtreye dönüştürün.
Oranların ortalaması
AVG([A]/[B]) ile SUM([A])/SUM([B]) farklı sorular yanıtlar. İş tanımınız hangisiyse onu yazın.
Sıfıra bölme
Payda sıfır olabiliyorsa IF ile NULL döndürün; aksi hâlde görselde tuhaf değerler belirir.
LOD ile table calc karışması
Biri sorgu seviyesinde, diğeri görsel düzeninde çalışır. Aynı görünen sayılar farklı şeyler olabilir.
Belgelenmemiş alanlar
Hesaplanmış alanın adına ve açıklamasına filtre kapsamını yazın; altı ay sonra kimse hatırlamaz.
Sonuç
Calculated Fields, iş mantığını Tableau'nun ölçü ve boyutlarına taşır. LOD ifadeleri ise bu mantığın hangi ayrıntı seviyesinde çalışacağını açıkça kontrol etmenizi sağlar: FIXED seviyeyi sabitler, INCLUDE ayrıntı ekler, EXCLUDE ayrıntı çıkarır.
Beklenmedik bir sayı gördüğünüzde sırayla şu üç soruyu sorun: bu hesap hangi seviyede çalışıyor, hangi filtreler ona ulaşıyor, görselde nasıl toplulaştırılıyor? Tableau'daki hataların neredeyse tamamı bu üç sorudan birinde saklıdır.
What is a calculated field?
A calculated field produces a new value by combining data source fields, constants and Tableau functions in an expression. Metrics such as profit margin, order segment, date grouping or total sales per customer are defined this way.
The key point: a calculated field does not change the source data; it only defines a new field available to the analysis. Three things determine the result — at what level of detail the calculation runs, which filters reach it, and how it is aggregated in the view. The vast majority of "why is this number wrong?" questions in Tableau trace back to one of those three.
Sales, Profit, Quantity, Customer Name, Category, Region and Order Date.Creating a field and row-level calculations
In Tableau, go to Analysis → Create Calculated Field, name the field, write the formula and check the validation message underneath. Once the formula is accepted, the field appears in the Data pane as a measure or a dimension.
// Discount amount per row
[Sales] * [Discount]

// Conditional order label
IF [Sales] >= 1000 THEN "High"
ELSEIF [Sales] >= 250 THEN "Medium"
ELSE "Standard"
END

// Order year
YEAR([Order Date])
All of these are computed separately for each data row. When you drag them into a view, Tableau aggregates them automatically — for a numeric field, SUM by default. That automatic aggregation is the source of the most common mistake in the next section.
Four kinds of calculation
| Type | Example | At what level does it run? |
|---|---|---|
| Row level | [Sales] * [Discount] | Per record |
| Aggregate | SUM([Profit]) / SUM([Sales]) | Per group in the view |
| LOD expression | { FIXED [Customer Name] : SUM([Sales]) } | Per the dimensions named in the expression |
| Table calculation | RUNNING_SUM(SUM([Sales])) | Per the layout of cells in the view |
A ratio shows the difference best. You can write profit margin two ways, and the results differ:
// RIGHT: aggregate first, then divide
IF SUM([Sales]) = 0 THEN NULL
ELSE SUM([Profit]) / SUM([Sales])
END

// WRONG (in most cases): the mean of row-level ratios
AVG([Profit] / [Sales])
The second weighs a 10-unit order the same as a 10,000-unit one. If you asked for the overall profit margin, the first is the right answer. This distinction — "mean of ratios" versus "ratio of totals" — is not specific to Tableau, but it is harder to spot there, because both formulas run without error.
What are LOD expressions for?
Normally a calculation runs at the level of detail set by the dimensions in the view. With Region in the view, it runs per region; with Region + Category, per region and category. LOD (Level of Detail) expressions break that dependency: you write the level the calculation should use.
{ FIXED | INCLUDE | EXCLUDE [Dimension(s)] : AGGREGATE EXPRESSION }The braces delimit the expression; the colon separates the dimension list from the aggregation.
In short: FIXED pins the level to the dimensions you name and ignores the view entirely. INCLUDE adds one more dimension to those in the view. EXCLUDE leaves a dimension that is in the view out of the calculation.
FIXED: a level independent of the view
FIXED is the most used LOD type. Its typical job is to produce a "customer total" or a "grand total" that does not move with the view's level of detail.
// Total sales per customer
{ FIXED [Customer Name] : SUM([Sales]) }

// Total sales across the whole dataset (no dimension)
{ FIXED : SUM([Sales]) }

// A customer's first order date — the basis of cohort analysis
{ FIXED [Customer Name] : MIN([Order Date]) }
That third example is very useful in practice. Once a customer's first order date is pinned, you can define a field such as "months since first order" and build cohort charts. Whatever dimensions are in the view, the first order date does not move.
FIXED and filters
The most confusing thing about FIXED is its filter behaviour. In Tableau's order of operations, FIXED is computed before dimension filters. So when you apply a "West region only" filter from the sidebar, the FIXED calculation still covers every region.
If that is not what you want, turn the filter into a context filter (right-click the filter → Add to Context). Context filters are applied before FIXED and do affect the result. This is the number-one cause of "I changed the filter and the number did not move".
INCLUDE: adding detail to the view
INCLUDE keeps the view's dimensions and adds one more for the calculation. Its most typical use is the "compute at a lower level, average at a higher one" pattern.
AVG(
  { INCLUDE [Customer Name] : SUM([Sales]) }
)
The expression works in two stages. Inside, Customer Name is added to the view's dimensions and a sales total is computed for each customer-category combination. The outer AVG then averages those totals at the view's level. With only Category in the view, the result answers: "how much does an average customer spend in this category?"
This is not easy to do without LOD. Writing AVG([Sales]) gives you the row average — the average order-line amount, not the average customer spend. Those are completely different questions.
Unlike FIXED, INCLUDE is evaluated after dimension filters. So sidebar filters affect which records enter the calculation. That is usually the behaviour you want.
EXCLUDE: removing a dimension
EXCLUDE drops a dimension that is in the view from the calculation. Its most common use is "part of the whole" ratios.
// With Region and Category in the view
SUM([Sales]) /
ATTR(
  { EXCLUDE [Category] : SUM([Sales]) }
)
The numerator is that cell's category sales. The denominator is the total across all categories in the same region — because Category was taken out of the calculation. The result gives the category's share within the region.
The ATTR wrapper is required here: because the EXCLUDE result repeats the same value across the rows of the view, Tableau expects an aggregation. ATTR means "if every value in this group is the same, return it", which is exactly right in this case.
The three side by side
| LOD | How is the level set? | Typical use | Effect of dimension filters |
|---|---|---|---|
| FIXED | Only the dimensions you write | Customer total, first order date, a global denominator | Unaffected unless it is a context filter |
| INCLUDE | View dimensions + the added one | Compute low, average high | Applied before the LOD, so it matters |
| EXCLUDE | View dimensions − the removed one | Share of total, regional subtotal | Applied before the LOD, so it matters |
Tableau's order of operations runs roughly as follows, and it is where you should return when a result surprises you:
- Extract
Filter - Data Source
Filter - Context
Filter - FIXED
- Dimension
Filters - INCLUDE
EXCLUDE
Which calculation should you use?
- Producing a new value for each row? A basic calculated field is enough.
- Want a total or ratio over the view's current groups? Use an aggregate calculation.
- Need a fixed level independent of the view? Consider FIXED.
- Want to compute at a lower level and average above it? INCLUDE.
- Removing a view dimension from the denominator? EXCLUDE.
- Cumulative, difference or rank relative to neighbouring cells? A table calculation.
I want to underline the last point: if all you want is a percent of total or a running total in the current view, a table calculation is usually simpler and faster than an LOD. Reach for LOD when you genuinely need a different level at query time.
Common mistakes
Summing a repeated LOD
FIXED values repeat across marks; SUM inflates the result. Consider AVG, MIN or ATTR.
FIXED skipping the filter
A sidebar filter does not reach FIXED. If you want it to, convert it to a context filter.
Averaging ratios
AVG([A]/[B]) and SUM([A])/SUM([B]) answer different questions. Write whichever your definition calls for.
Division by zero
If the denominator can be zero, return NULL with an IF; otherwise odd values appear in the view.
Confusing LOD with table calcs
One runs at query level, the other at view layout. Numbers that look the same can mean different things.
Undocumented fields
Put the filter scope into the calculated field's name and description; nobody will remember in six months.
Conclusion
Calculated fields move business logic into Tableau's measures and dimensions. LOD expressions let you control explicitly at which level of detail that logic runs: FIXED pins the level, INCLUDE adds detail, EXCLUDE removes it.
When a number surprises you, ask these three questions in order: at what level does this calculation run, which filters reach it, and how is it aggregated in the view? Nearly every Tableau error hides in one of the three.