Python ve R Karşılaştırması: Veri Analizi İçin Hangisi Daha İyi?
Tek bir kazanan yok. İki dili veri temizleme, istatistiksel modelleme, görselleştirme, makine öğrenmesi ve raporlama başlıklarında yan yana koyuyor; hangi senaryoda hangisinin işinizi kolaylaştırdığını örnek kodlarla gösteriyorum.
- Araçlar
- Kariyer
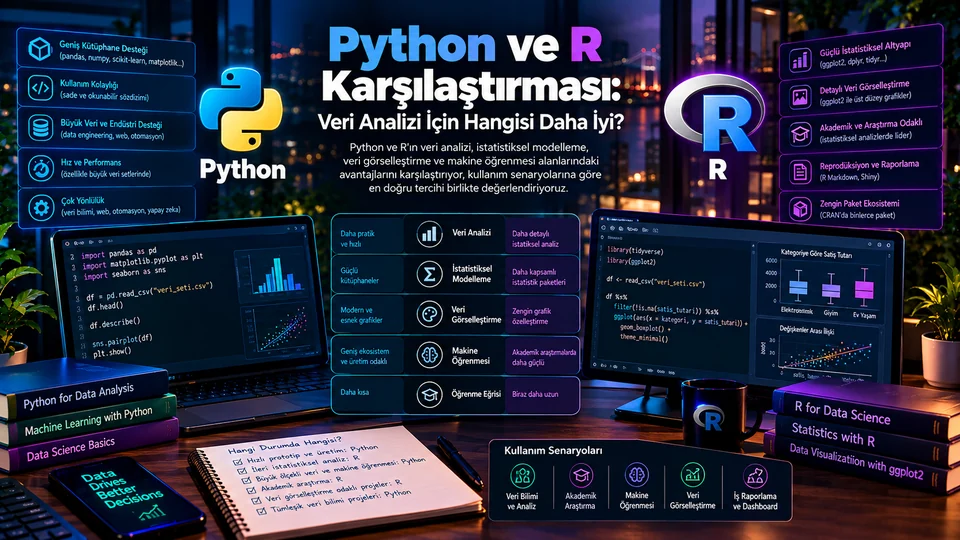
Önce kısa cevap: hangisini seçmelisiniz?
Tek bir evrensel kazanan yok. En doğru seçim; çözmek istediğiniz probleme, çalıştığınız ekibe ve analizin hangi noktada kullanılacağına bağlı.
Python daha uygun olabilir
Veri analizi ile yazılım geliştirmeyi birleştirmek, makine öğrenmesi modellerini ürünleştirmek, API ve otomasyon süreçleri kurmak veya genel amaçlı bir dil öğrenmek istiyorsanız.
R daha uygun olabilir
İstatistiksel analiz, deney tasarımı, akademik araştırma, metodolojik raporlama ve yüksek nitelikli istatistik grafikleri önceliğinizse; özellikle tidyverse ve Quarto'dan yararlanacaksanız.
Python ve R'ın temel farkı
Python genel amaçlı bir programlama dilidir. Veri biliminin yanında web servisleri, otomasyon, uygulama geliştirme ve yazılım altyapılarında da kullanılır. Veri ekosistemi NumPy, pandas, Polars, SciPy, scikit-learn ve PyTorch gibi kütüphanelerle genişler.
R ise istatistiksel hesaplama ve grafik üretimi odağında gelişmiş bir dil ve ortamdır. Veri düzenleme için dplyr ve tidyr, görselleştirme için ggplot2, istatistiksel modelleme için çok sayıda uzmanlaşmış paket ve raporlama için Quarto gibi araçlar sunar.
| Başlık | Python | R |
|---|---|---|
| Genel amaçlı yazılım | Çok güçlü; uygulama ve servislerle doğal entegrasyon | Mümkün, ama ana odağı bu değil |
| Veri düzenleme | pandas, Polars, NumPy | dplyr, tidyr, data.table |
| İstatistik | SciPy, statsmodels ve uzmanlaşmış paketler | Geniş, istatistik odaklı paket ekosistemi |
| Grafikler | matplotlib, seaborn, plotly, altair | ggplot2, lattice, plotly |
| Makine öğrenmesi | scikit-learn, XGBoost, PyTorch | tidymodels, caret, mlr3 |
| Raporlama | Jupyter, Quarto, dashboard araçları | Quarto, R Markdown, Shiny |
Veri analizi ve veri temizleme
Her iki dil de eksik değerleri inceleme, kayıtları filtreleme, sütunları dönüştürme, gruplama ve tabloları birleştirme işlerini rahatlıkla yapar. Fark çoğunlukla sözdiziminde ve ekibin aşina olduğu araçlardadır.
Python: pandas ile gruplama
import pandas as pd

df = pd.read_csv("paylasimlar.csv")
df["tarih"] = pd.to_datetime(df["tarih"], errors="coerce")

ozet = (
    df.dropna(subset=["marka"])
      .groupby("marka", as_index=False)
      .agg(
          mention_sayisi=("kayit_id", "count"),
          ortalama_puan=("puan", "mean")
      )
)
R: dplyr ile aynı fikri ifade etmek
library(dplyr)
library(readr)

df <- read_csv("paylasimlar.csv") |>
  mutate(tarih = as.Date(tarih))

ozet <- df |>
  filter(!is.na(marka)) |>
  group_by(marka) |>
  summarise(
    mention_sayisi = sum(!is.na(kayit_id)),
    ortalama_puan  = mean(puan, na.rm = TRUE),
    .groups = "drop"
  )
İki örnek aynı analiz fikrini gösterir; birebir aynı sonuç için veri tipi, eksik değer politikası ve sayım tanımı da aynı olmalıdır. pandas'ta count eksik olmayan değerleri sayar; R örneğinde de bilerek sum(!is.na(...)) yazıldı. mean() tarafında ise fark daha sinsi: pandas ortalamada eksikleri varsayılan olarak atlar, R'da aynı davranış için na.rm = TRUE yazmanız gerekir.
İstatistiksel modelleme: R'ın öne çıktığı yer
R, istatistiksel düşünce merkezli işlerde doğal bir tercihtir. Regresyon, genelleştirilmiş doğrusal modeller, karma etkili modeller, zaman serileri, sağkalım analizi, deney tasarımı ve istatistiksel testler için olgun paketlere sahiptir. Formül tabanlı model tanımları ve summary() çıktıları istatistiksel iş akışını okunur kılar.
model <- lm(satis ~ reklam_harcamasi + sezon, data = df)
summary(model)
confint(model)
Python da bu alanda güçlüdür. statsmodels katsayı tabloları, standart hatalar, güven aralıkları ve istatistiksel testler sunar; SciPy çeşitli test ve sayısal yöntemleri sağlar.
import statsmodels.formula.api as smf

model = smf.ols(
    "satis ~ reklam_harcamasi + C(sezon)",
    data=df
).fit()

print(model.summary())
print(model.conf_int())
İki örnekteki C(sezon) ve sezon farkı önemli: R, karakter ve faktör sütunlarını modelde otomatik olarak kategorik değişken sayar. Python'da ise C() ile açıkça belirtmezseniz sayısal gibi işlenebilir. Dil değiştirirken en sık yapılan sessiz hatalardan biri budur.
Son olarak: istatistiksel modellemede katsayı üretmek işin kolay kısmı. Varsayımlar, artık analizi, model tanımlaması, belirsizlik ve araştırma tasarımı dil seçiminden çok daha belirleyicidir.
Veri görselleştirme: ggplot2 ve Python ekosistemi
R'ın ggplot2 paketi grafikleri veri, estetik eşleme ve geometriler üzerinden katmanlı biçimde kurar. Aynı tasarım dilini farklı grafik türlerine uygulamak, raporlar arasında tutarlılık sağlamayı kolaylaştırır.
library(ggplot2)

ggplot(df, aes(x = tarih, y = mention, color = marka)) +
  geom_line(linewidth = 0.8) +
  labs(
    title = "Markalara göre mention eğilimi",
    x = "Tarih", y = "Mention sayısı",
    color = "Marka"
  ) +
  theme_minimal()
Python'da matplotlib ayrıntılı kontrol sağlar; seaborn istatistiksel grafikleri hızlandırır, plotly etkileşimli görselleri kolaylaştırır. Ekosistem geniştir ve web tabanlı uygulamalara bağlanması rahattır.
import seaborn as sns
import matplotlib.pyplot as plt

sns.lineplot(
    data=df, x="tarih", y="mention",
    hue="marka", errorbar=None
)
plt.title("Markalara göre mention eğilimi")
plt.tight_layout()
plt.show()ggplot2
Katmanlı grafik mantığı, yayın kalitesinde görseller ve raporlarla tutarlı grafik üretimi.
Python grafikleri
Geniş grafik seçenekleri, web ve uygulama entegrasyonu, etkileşimli görsel alternatifleri.
Makine öğrenmesi ve yapay zekâ
Python, makine öğrenmesi ve derin öğrenmede çok geniş bir ekosisteme sahiptir. scikit-learn klasik iş akışları için, PyTorch ve TensorFlow sinir ağları için yaygın araçlardır. Modeli servis olarak sunma, veri boru hatlarına bağlama ve üretime taşıma seçenekleri de güçlüdür.
R tarafında tidymodels, caret ve mlr3 model geliştirme ve değerlendirme süreçlerini düzenler. R; istatistiksel öğrenme, deneysel analiz ve model sonuçlarını raporlama odaklı projelerde oldukça yeteneklidir.
| İhtiyaç | Öne çıkan seçenek | Neden? |
|---|---|---|
| Klasik sınıflandırma / regresyon | Her ikisi | İki ekosistemde de olgun araçlar var. |
| Derin öğrenme ve GPU | Genellikle Python | PyTorch ve TensorFlow çevresindeki ekosistem ve kaynaklar. |
| İstatistiksel öğrenme ve raporlama | R veya Python | Yöntem, ekip ve raporlama gereksinimine bağlı. |
| Modeli web servisi olarak sunma | Genellikle Python | Web servisleri ve uygulama altyapılarıyla doğal entegrasyon. |
Otomatik raporlama, dashboard ve paylaşım
R Markdown ve Quarto; kodu, açıklamayı, tabloları ve grafikleri tek belgede birleştirerek tekrarlanabilir raporlar üretir. Shiny, R ile etkileşimli veri uygulamaları ve dashboard geliştirmek için güçlü bir seçenektir.
Python'da Jupyter Notebook keşifsel analiz ve prototipleme için yaygındır. Streamlit, Dash ve benzeri araçlarla etkileşimli uygulamalar hazırlanır. Python'ın web çerçeveleriyle entegrasyonu, analitik çıktıları daha geniş yazılım ürünlerine taşımayı kolaylaştırır.
R Markdown / Quarto
Tekrarlanabilir raporlar, teknik belgeler, sunumlar ve analiz sonuçlarını kodla birlikte yayımlama.
Jupyter / uygulama araçları
Keşifsel çalışma, prototipleme, servis entegrasyonu ve etkileşimli analitik arayüzleri.
Hangisi daha hızlı?
“Python her zaman daha hızlıdır” veya “R daha hızlıdır” gibi genellemeler yanıltıcıdır. Performans; veri boyutuna, algoritmaya, paketin uygulamasına, bellek kullanımına, I/O maliyetine ve işlemin nasıl yazıldığına bağlıdır.
- Vektörleştirme: satır satır döngüler yerine uygun vektör işlemleri çoğu zaman kat kat daha verimlidir — bu iki dilde de geçerlidir.
- Bellek: verinin tamamını RAM'e yüklemek yerine Parquet, veritabanları veya parçalı işleme gerekebilir.
- Büyük veri: Python'da Polars, Dask ve Spark entegrasyonları; R'da data.table, Arrow ve Spark bağlantıları belirli senaryolarda belirgin kazanç sağlar.
- Ölçüm: gerçek iş yükünüz üzerinde ölçün. Küçük bir örnekten tüm üretim ortamı için sonuç çıkarmayın.
Kullanım senaryosuna göre seçim
| Senaryo | Öneri | Değerlendirme |
|---|---|---|
| İstatistik, hipotez testleri, deney tasarımı | R güçlü aday | İstatistik odaklı paketler ve raporlama yaklaşımı avantaj sağlar. |
| Veri analizi + otomasyon + uygulama | Python güçlü aday | Analizden uygulamaya geçiş tek ekosistemde yürütülebilir. |
| Yayın kalitesinde grafik ve rapor | Her ikisi | R + ggplot2 ve Quarto çok güçlü; Python da zengin seçenekler sunar. |
| Derin öğrenme ve üretim ML | Genellikle Python | Kütüphane ekosistemi ve üretim araçları avantaj sağlar. |
| Akademik araştırma ve tekrarlanabilir rapor | Her ikisi; R sık tercih edilir | Yöntem, alan geleneği ve ekip araçları belirleyicidir. |
| Mevcut teknoloji yığınına entegrasyon | Altyapıya göre | Veri ambarı, ekip becerileri, dağıtım ve bakım maliyetini değerlendirin. |
İkisini birden öğrenmek mantıklı mı?
Evet — ama aynı anda iki dilde her şeyi öğrenmeye çalışmak yerine birini ana araç seçmek daha verimlidir. Önce veri analizi temellerini, veri temizleme mantığını, görselleştirmeyi ve model değerlendirmeyi öğrenin. Sonra ikinci dile geçerken aynı kavramları öteki sözdizimiyle uygulayın.
- Bir Dili
Seç - Gerçek Proje
Geliştir - İkinci Dile
Aktar - Sonuçları
Kıyasla
Örneğin aynı veri setinde veriyi temizleyin, gruplu özetler üretin, bir regresyon modeli kurun ve sonuçları görselleştirin. Bu karşılaştırma yalnızca sözdizimini değil, her ekosistemin gerçekten güçlü olduğu alanları da gösterir. İki dilde aynı sayıyı üretmeye çalışmak, kendi varsayımlarınızı fark etmenin de en hızlı yoludur.
Önce problemi seçin, sonra dili
Python; çok yönlü programlama, makine öğrenmesi ve analitik sistemleri uygulamaya dönüştürme ihtiyacı olanlar için güçlü bir başlangıç noktasıdır. R ise istatistiksel analiz, grafik üretimi ve tekrarlanabilir raporlamada son derece verimli bir çalışma ortamı sunar.
Günlük işiniz ağırlıklı olarak istatistiksel analiz ve raporlamaysa R'ı; analizle birlikte otomasyon, yazılım entegrasyonu ve üretime geçiş de yapacaksanız Python'ı önceliklendirin. Ancak mevcut ekip, alanınızın araçları ve proje gereksinimleri bu genel eğilimlerden daha belirleyicidir.
The short answer first: which should you choose?
There is no universal winner. The right choice depends on the problem you are solving, the team you work with, and where the analysis will end up being used.
Python may suit you better
If you want to combine data analysis with software development, productionise machine learning models, build APIs and automation, or learn a general-purpose language.
R may suit you better
If statistical analysis, experimental design, academic research, methodological reporting and high-quality statistical graphics are your priority — especially with tidyverse and Quarto.
The fundamental difference
Python is a general-purpose programming language. Beyond data science it is used for web services, automation, application development and software infrastructure. Its data ecosystem extends through NumPy, pandas, Polars, SciPy, scikit-learn and PyTorch.
R is a language and environment built around statistical computing and graphics. It offers dplyr and tidyr for data wrangling, ggplot2 for visualisation, a large number of specialised packages for statistical modelling, and tools like Quarto for reporting.
| Area | Python | R |
|---|---|---|
| General-purpose software | Very strong; natural integration with apps and services | Possible, but not its main focus |
| Data wrangling | pandas, Polars, NumPy | dplyr, tidyr, data.table |
| Statistics | SciPy, statsmodels and specialised packages | A broad, statistics-focused package ecosystem |
| Graphics | matplotlib, seaborn, plotly, altair | ggplot2, lattice, plotly |
| Machine learning | scikit-learn, XGBoost, PyTorch | tidymodels, caret, mlr3 |
| Reporting | Jupyter, Quarto, dashboard tools | Quarto, R Markdown, Shiny |
Data analysis and cleaning
Both languages comfortably handle inspecting missing values, filtering records, transforming columns, grouping and joining tables. The difference is mostly syntax and what the team already knows.
Python: grouping with pandas
import pandas as pd

df = pd.read_csv("paylasimlar.csv")
df["tarih"] = pd.to_datetime(df["tarih"], errors="coerce")

ozet = (
    df.dropna(subset=["marka"])
      .groupby("marka", as_index=False)
      .agg(
          mention_sayisi=("kayit_id", "count"),
          ortalama_puan=("puan", "mean")
      )
)
R: the same idea in dplyr
library(dplyr)
library(readr)

df <- read_csv("paylasimlar.csv") |>
  mutate(tarih = as.Date(tarih))

ozet <- df |>
  filter(!is.na(marka)) |>
  group_by(marka) |>
  summarise(
    mention_sayisi = sum(!is.na(kayit_id)),
    ortalama_puan  = mean(puan, na.rm = TRUE),
    .groups = "drop"
  )
The two examples express the same analytical idea; for identical results the data types, missing-value policy and the definition of a count must also match. In pandas, count counts non-missing values, so the R example deliberately uses sum(!is.na(...)). The mean() side is sneakier: pandas skips missing values by default, while R needs an explicit na.rm = TRUE for the same behaviour.
Statistical modelling: where R stands out
R is a natural choice for work centred on statistical thinking. It has mature packages for regression, generalised linear models, mixed-effects models, time series, survival analysis, experimental design and statistical tests. Formula-based model definitions and summary() output make the statistical workflow readable.
model <- lm(satis ~ reklam_harcamasi + sezon, data = df)
summary(model)
confint(model)
Python is strong here too. statsmodels provides coefficient tables, standard errors, confidence intervals and statistical tests; SciPy supplies a range of tests and numerical methods.
import statsmodels.formula.api as smf

model = smf.ols(
    "satis ~ reklam_harcamasi + C(sezon)",
    data=df
).fit()

print(model.summary())
print(model.conf_int())
The difference between C(sezon) and plain sezon matters: R automatically treats character and factor columns as categorical in a model. In Python, unless you say C() explicitly, the column may be handled as numeric. This is one of the most common silent mistakes when moving between the two.
And finally: producing coefficients is the easy part of statistical modelling. Assumptions, residual analysis, model specification, uncertainty and study design matter far more than the choice of language.
Visualisation: ggplot2 and the Python ecosystem
R's ggplot2 builds charts in layers through data, aesthetic mappings and geometries. Applying the same design language across chart types makes consistency between reports much easier.
library(ggplot2)

ggplot(df, aes(x = tarih, y = mention, color = marka)) +
  geom_line(linewidth = 0.8) +
  labs(
    title = "Mention trend by brand",
    x = "Date", y = "Mentions",
    color = "Brand"
  ) +
  theme_minimal()
In Python, matplotlib gives detailed control, seaborn speeds up statistical charts, and plotly makes interactive visuals straightforward. The ecosystem is broad and connects comfortably to web applications.
import seaborn as sns
import matplotlib.pyplot as plt

sns.lineplot(
    data=df, x="tarih", y="mention",
    hue="marka", errorbar=None
)
plt.title("Mention trend by brand")
plt.tight_layout()
plt.show()ggplot2
Layered grammar of graphics, publication-quality visuals and charts consistent with your reports.
Python charts
A wide range of chart options, web and application integration, and interactive alternatives.
Machine learning and AI
Python has a very broad ecosystem in machine learning and deep learning. scikit-learn is standard for classic workflows; PyTorch and TensorFlow for neural networks. Serving a model, wiring it into data pipelines and moving it to production are all well supported.
On the R side, tidymodels, caret and mlr3 organise model development and evaluation. R is highly capable in projects centred on statistical learning, experimental analysis and reporting model results.
| Need | Leading option | Why? |
|---|---|---|
| Classic classification / regression | Either | Both ecosystems have mature tools. |
| Deep learning and GPU work | Usually Python | The ecosystem and resources around PyTorch and TensorFlow. |
| Statistical learning and reporting | R or Python | Depends on method, team and reporting needs. |
| Serving a model as a web service | Usually Python | Natural integration with web services and app infrastructure. |
Automated reporting, dashboards and sharing
R Markdown and Quarto combine code, narrative, tables and charts into a single document to produce reproducible reports. Shiny is a strong option for building interactive data applications and dashboards in R.
In Python, Jupyter Notebook is widespread for exploratory analysis and prototyping. Streamlit, Dash and similar tools build interactive applications. Python's integration with web frameworks makes it easier to carry analytical output into larger software products.
R Markdown / Quarto
Reproducible reports, technical documents, presentations and publishing results alongside the code.
Jupyter / app tools
Exploratory work, prototyping, service integration and interactive analytical interfaces.
Which one is faster?
Generalisations like “Python is always faster” or “R is faster” are misleading. Performance depends on data size, the algorithm, the package implementation, memory use, I/O cost and how the operation is written.
- Vectorisation: proper vector operations instead of row-by-row loops are often many times more efficient — in both languages.
- Memory: instead of loading everything into RAM, Parquet, databases or chunked processing may be needed.
- Large data: Polars, Dask and Spark integrations in Python; data.table, Arrow and Spark connectors in R bring real gains in specific scenarios.
- Measure: benchmark on your actual workload. Do not generalise from a small sample to the whole production environment.
Choosing by use case
| Scenario | Suggestion | Consideration |
|---|---|---|
| Statistics, hypothesis tests, experimental design | R is a strong candidate | Statistics-focused packages and the reporting approach are an advantage. |
| Analysis + automation + applications | Python is a strong candidate | The path from analysis to application stays in one ecosystem. |
| Publication-quality charts and reports | Either | R with ggplot2 and Quarto is very strong; Python also offers rich options. |
| Deep learning and production ML | Usually Python | Library ecosystem and production tooling give it the edge. |
| Academic research and reproducible reports | Either; R is often preferred | Method, field convention and team tooling decide it. |
| Integration with an existing stack | Follow the infrastructure | Weigh the data warehouse, team skills, deployment and maintenance cost. |
Does it make sense to learn both?
Yes — but rather than trying to learn everything in both at once, it is more efficient to pick one as your main tool. Learn the fundamentals of data analysis, the logic of cleaning, visualisation and model evaluation first. Then, moving to the second language, apply the same concepts in the other syntax.
- Pick a
Language - Build a Real
Project - Port to the
Second - Compare the
Results
Take the same dataset: clean it, produce grouped summaries, fit a regression and visualise the results. That comparison shows you not only the syntax but where each ecosystem is genuinely strong. Trying to produce the same number in two languages is also the fastest way to notice your own assumptions.
Choose the problem first, then the language
Python is a strong starting point for anyone who needs versatile programming, machine learning and the ability to turn analytical systems into applications. R offers a highly efficient working environment for statistical analysis, graphics and reproducible reporting.
If your daily work is mostly statistical analysis and reporting, prioritise R; if you will also be doing automation, software integration and production deployment alongside the analysis, prioritise Python. But your current team, your field's tooling and the project's requirements decide more than these general tendencies.