Power BI Veri Modelleme: Star Schema Nedir?
Fact ve dimension tablolarından ilişkilere, filtre yönünden rapor performansına kadar Power BI'da star schema yaklaşımını bir satış modeli üzerinden inceliyorum.
- Araçlar
- Veri Görselleştirme
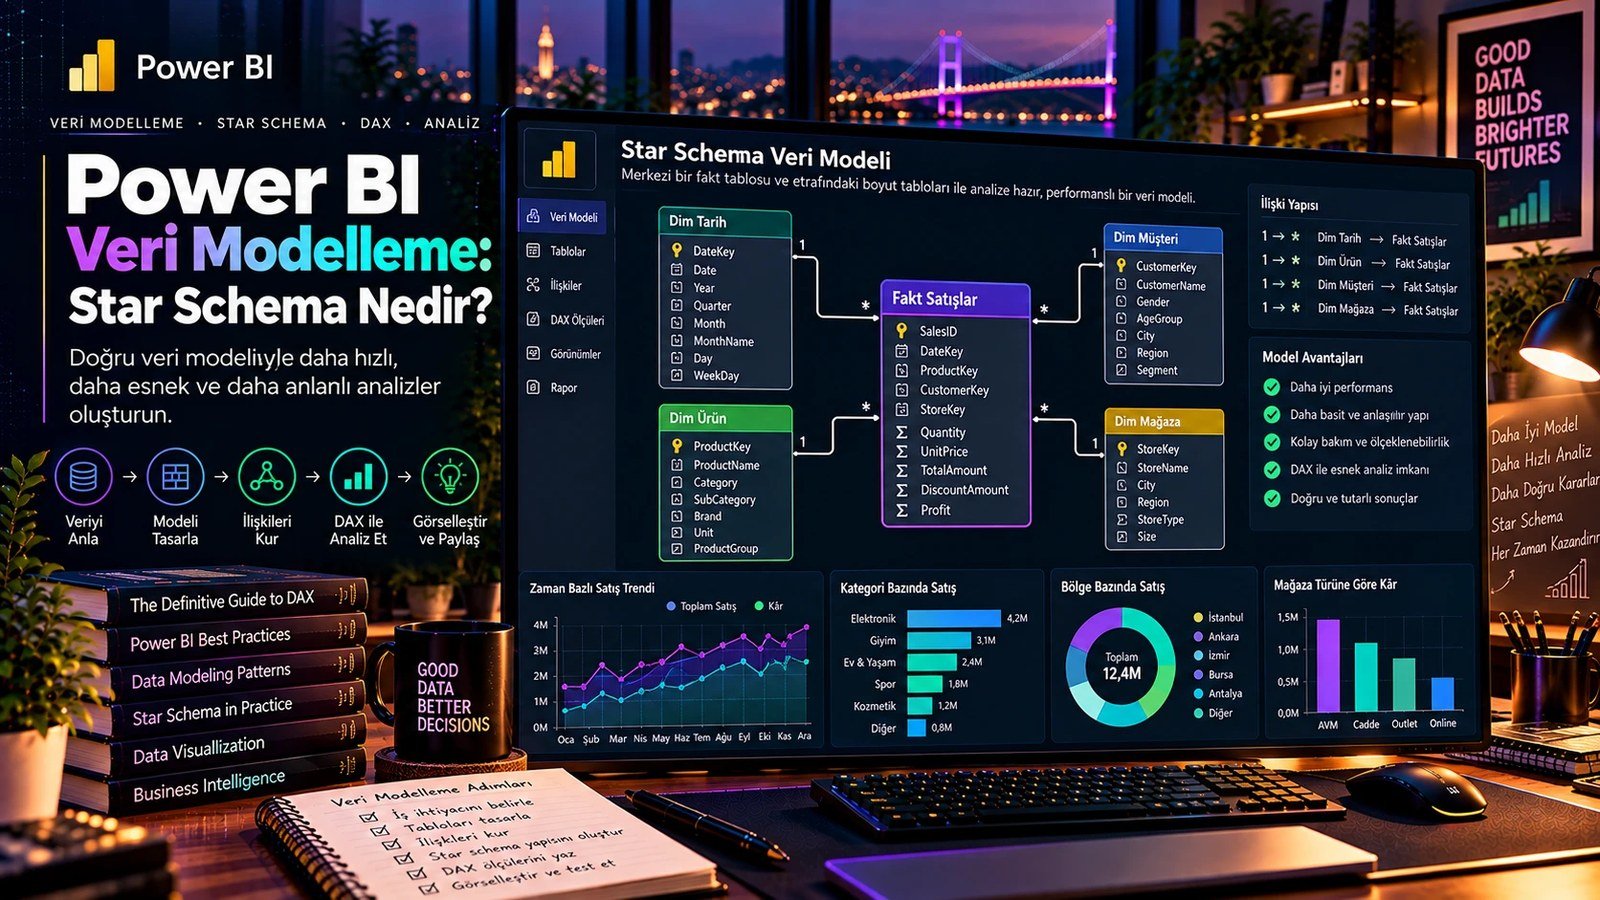
İyi bir Power BI raporu yalnızca doğru grafiklerden oluşmaz. Verinin nasıl organize edildiği, tabloların nasıl ilişkilendirildiği ve filtrelerin model içinde nasıl aktığı da raporun doğruluğunu, performansını ve sürdürülebilirliğini belirler.
Bu yazıda star schema yaklaşımını; fact ve dimension tablolarını, ilişkileri, filtre yönünü ve bütün bunların rapor performansına etkisini bir satış modeli üzerinden ele alıyorum.
“Güzel görünen bir dashboard kullanıcıyı ilk anda etkiler; iyi tasarlanmış bir veri modeli ise raporun arkasındaki bütün karar sürecini sağlamlaştırır.”
1. Power BI'da Veri Modelleme Nedir?
Veri modelleme; farklı kaynaklardan gelen tabloların raporda anlamlı ve doğru şekilde kullanılabilmesi için belirli bir mantıkla düzenlenmesi ve birbirleriyle ilişkilendirilmesidir. Power BI'da model, tabloların yan yana durduğu bir alan değil; boyutların filtreleme mantığını ve ölçülerin hangi bağlamda hesaplanacağını belirleyen raporun omurgasıdır.
Doğruluk
İlişkiler doğru kurulursa toplamlar, kırılımlar ve DAX ölçüleri daha güvenilir sonuç verir.
Performans
Daha sade ve öngörülebilir bir model, sorguların gereksiz hesaplama yapmasını azaltır.
Sürdürülebilirlik
Yeni ölçü ve rapor sayfaları eklenirken modelin mantığını anlamak ve yönetmek kolaylaşır.
- Veriyi
Anla - Modeli
Tasarla - İlişkileri
Kur - DAX ile
Analiz Et - Görselleştir
2. Star Schema Nedir?
Star schema (yıldız şema), merkezde bir veya daha fazla fact table'ın, çevresinde ise onu tanımlayan dimension table'ların bulunduğu veri modelleme yaklaşımıdır. Görsel olarak bir yıldızı andırdığı için bu isimle anılıyor.
Buradaki önemli nokta, dimension tablolarının genellikle filtreleme ve gruplama amacıyla, fact tablosunun ise ölçümlerin hesaplanması için kullanılması.
3. Fact ve Dimension Tabloları Arasındaki Fark
| Özellik | Fact table | Dimension table |
|---|---|---|
| Amaç | Olayları ve ölçülebilir değerleri saklamak | Olayları açıklamak ve filtrelemek |
| Örnek | FactSales | DimProduct, DimCustomer, DimDate |
| Veri tipi | Adet, ciro, maliyet gibi ölçümler + anahtarlar | Ürün, kategori, müşteri, şehir gibi açıklayıcı alanlar |
| Kayıt sayısı | Genellikle yüksek | Genellikle daha düşük |
| Kullanım | SUM, AVERAGE, COUNT gibi hesaplamaların temeli | Filtreleme, gruplama ve detaya inme |
Örnek FactSales tablosu
| SalesID | DateKey | ProductKey | CustomerKey | StoreKey | Quantity | SalesAmount |
|---|---|---|---|---|---|---|
| 1001 | 20261001 | 12 | 301 | 4 | 2 | 1.800 ₺ |
| 1002 | 20261001 | 18 | 304 | 2 | 1 | 950 ₺ |
| 1003 | 20261002 | 12 | 309 | 4 | 3 | 2.700 ₺ |
Fact tablosundaki DateKey, ProductKey, CustomerKey ve StoreKey alanları, çevredeki dimension tablolarına bağlanan anahtarlar.
4. Tablolar Arasındaki İlişkiler Nasıl Kurulur?
Star schema'da en yaygın ilişki tipi bire-çok (1:*) ilişkisi. Örneğin bir ürün dimension tablosunda bir kez bulunurken, o ürün FactSales tablosunda yüzlerce veya binlerce satış satırına karşılık gelebilir.
DimDate[DateKey]          1 ──→ * FactSales[DateKey]
DimProduct[ProductKey]    1 ──→ * FactSales[ProductKey]
DimCustomer[CustomerKey]  1 ──→ * FactSales[CustomerKey]
DimStore[StoreKey]        1 ──→ * FactSales[StoreKey]
Tek bir ürün birçok satış kaydında yer alabilir. Filtre DimProduct'tan FactSales'a doğru aktığında, seçilen kategori veya ürün satış ölçülerini otomatik olarak etkiler.
Filtre yönü
Basit yıldız şemalarında dimension → fact yönü çoğu senaryo için daha kontrollü bir tasarım sağlar.
Teknik anahtar
Kurumsal modellerde dimension kayıtlarını stabil bir anahtarla eşlemek yönetimi kolaylaştırır.
5. Basit Bir Satış Veri Modeli
Bir perakende şirketinin günlük satışlarını analiz ettiğimizi düşünelim. Elimizde satış hareketleri, ürünler, müşteriler, mağazalar ve takvim bilgileri bulunuyor.
DimDate
DateKey, Date, Year, Quarter, Month, MonthName, Week, DayName
DimProduct
ProductKey, ProductName, Category, Brand, UnitPrice
DimCustomer
CustomerKey, CustomerName, Segment, City, Region
DimStore
StoreKey, StoreName, City, Region, StoreType
FactSales
SalesID, DateKey, ProductKey, CustomerKey, StoreKey, Quantity, SalesAmount, CostAmount
Böyle bir yapı sayesinde “İstanbul'daki elektronik ürün satışları 2026'nın hangi ayında arttı?” sorusu tek bir model üzerinden analiz edilebilir. Kullanıcı DimStore'dan şehir, DimProduct'tan kategori, DimDate'ten yıl ve ay seçtiğinde FactSales üzerindeki ölçüler buna göre filtrelenir.
Basit DAX ölçüleri
Toplam Satis =
SUM(FactSales[SalesAmount])

Toplam Adet =
SUM(FactSales[Quantity])

Toplam Maliyet =
SUM(FactSales[CostAmount])

Brut Kar =
[Toplam Satis] - [Toplam Maliyet]

Kar Marji =
DIVIDE([Brut Kar], [Toplam Satis])
6. Power BI'da Star Schema Nasıl Kurulur?
Power BI'da modelleme genellikle Power Query'de verinin hazırlanmasıyla başlar, ardından model görünümünde tabloların ilişkileri oluşturulur. İyi sonuç almak için rapora gelmeden önce gereksiz kolonları ve kullanılmayacak verileri mümkün olduğunca azaltmak gerekiyor.
Veriyi temizle
Kaynak tabloları Power Query'de temizle ve biçimlendir.
Tabloları ayır
Fact ve dimension tablolarını birbirinden net biçimde ayır.
Anahtar oluştur
Boyut tablolarında benzersiz anahtarlar tanımla.
İlişkileri kur
İlişkileri mümkün olduğunca 1:* mantığında tasarla.
Tarih tablosu ekle
Takvimi ayrı bir dimension olarak oluştur.
İş mantığını ölçülere taşı
Hesaplamaları mümkün olduğunca measure'larda topla.
7. Veri Modelinin Rapor Performansına Etkisi
Power BI'da performans yalnızca donanım veya görsel sayısıyla ilgili değil. Modelin yapısı, veri hacmi, kolonların kardinalitesi, ilişkiler ve yazılan DAX sorguları birlikte sonucu etkiliyor.
Model sadeleşir
Tekrarlı alanları dimension ve fact sınırları içinde düzenlemek modeli anlaşılır kılar.
Filtreleme netleşir
Dimension → fact akışı, kullanıcı seçimlerinin hangi ölçüyü etkileyeceğini öngörülebilir yapar.
Ölçüler okunur olur
Ölçüler fact tablosundaki sayısal alanlara odaklanır; boyutlar analiz bağlamını sağlar.
Ürün, müşteri, şehir ve kategori gibi bilgileri dev bir satış tablosunda sürekli tekrar etmek yerine dimension tablolarında tutmak modeli daha mantıklı bir yapıya taşıyor. Özellikle veri hacmi büyüdükçe sadelik ve tutarlılık belirleyici hale geliyor.
8. Sık Yapılan Veri Modelleme Hataları
| Hata | Neden sorun? | Daha iyi yaklaşım |
|---|---|---|
| Tek tabloyla her şeyi çözmeye çalışmak | Tekrarlı alanlar, karmaşıklık ve yönetim zorluğu | Uygun fact / dimension ayrımı |
| Çok fazla çoka-çok ilişki | Filtre akışı ve ölçülerin davranışı karmaşıklaşır | Gerekirse ara (bridge) tablo kullanmak |
| Gereksiz çift yönlü filtreleme | Beklenmeyen filtre yayılımı | Mümkün olduğunca kontrollü tek yön |
| Tarih tablosu kullanmamak | Zaman analizleri ve DAX tarih hesapları zorlaşır | Standart bir DimDate oluşturmak |
| Gereksiz kolonları modele almak | Model boyutu ve sorgu maliyeti artar | Yalnızca gerekli alanları tutmak |
9. İyi Bir Power BI Modeli İçin Kontrol Listesi
Fact tablosu
Tek bir iş olayını temsil ediyor mu? Satırın neyi temsil ettiği net mi? Ölçülebilir alanlar doğru mu?
Dimension tabloları
Filtre ve kırılım alanları anlaşılır mı? Anahtarlar benzersiz mi? Gereksiz tekrar var mı?
İlişkiler
Kardinalite doğru mu? Filtre yönü beklenen gibi mi? Gereksiz karmaşık bağlantı var mı?
Rapor performansı
Model gereksiz alanlardan arındırıldı mı? Ölçüler doğru bağlamda çalışıyor mu? Yavaş görsellerin kaynağı incelendi mi?
Sonuç: İyi Raporun Temeli İyi Modeldir
Power BI'da etkili raporlama yalnızca grafik seçmekten ibaret değil. Raporun arkasındaki veri modelinin doğru kurulması; ölçülerin güvenilir çalışmasını, filtrelerin tahmin edilebilir davranmasını, yeni analizlerin kolay eklenmesini ve modelin uzun vadede rahat yönetilmesini sağlıyor.
Star schema yaklaşımında fact table ölçülebilir olayları merkezde tutar; dimension table'lar ise bu olayları tarih, ürün, müşteri ve mağaza gibi boyutlarla açıklar. Doğru ilişkiler ve sade bir model, raporun hem analitik kalitesini hem de kullanım deneyimini güçlendirir.
“Veri modelleme, rapor tasarımından önce gelmesi gereken temel becerilerden biridir.”
A good Power BI report is not made of the right charts alone. How the data is organised, how the tables relate to each other and how filters flow through the model all shape the report's accuracy, performance and sustainability.
In this post I go through the star schema approach — fact and dimension tables, relationships, filter direction and the effect all of this has on report performance — over a sales model.
“A good-looking dashboard impresses at first sight; a well-designed data model strengthens the whole decision process behind the report.”
1. What Is Data Modeling in Power BI?
Data modeling is arranging and relating tables that come from different sources so they can be used meaningfully and correctly in a report. In Power BI the model is not an area where tables simply sit side by side; it is the backbone that defines the filtering logic of the dimensions and the context in which measures are calculated.
Accuracy
When the relationships are right, totals, breakdowns and DAX measures give more reliable results.
Performance
A simpler, more predictable model reduces unnecessary work in the queries.
Sustainability
Adding new measures and report pages stays manageable because the logic of the model is clear.
- Understand
the Data - Design the
Model - Build
Relationships - Analyse
with DAX - Visualise
2. What Is a Star Schema?
A star schema is a modeling approach with one or more fact tables in the centre and the dimension tables that describe them around it. It gets its name from looking like a star.
The important part is that dimension tables are generally used for filtering and grouping, while the fact table is used to calculate the measures.
3. The Difference Between Fact and Dimension Tables
| Property | Fact table | Dimension table |
|---|---|---|
| Purpose | Store events and measurable values | Describe and filter the events |
| Example | FactSales | DimProduct, DimCustomer, DimDate |
| Data type | Measures such as quantity, revenue, cost + keys | Descriptive fields such as product, category, customer, city |
| Row count | Usually high | Usually lower |
| Usage | The basis of SUM, AVERAGE, COUNT | Filtering, grouping and drill-down |
An example FactSales table
| SalesID | DateKey | ProductKey | CustomerKey | StoreKey | Quantity | SalesAmount |
|---|---|---|---|---|---|---|
| 1001 | 20261001 | 12 | 301 | 4 | 2 | ₺1,800 |
| 1002 | 20261001 | 18 | 304 | 2 | 1 | ₺950 |
| 1003 | 20261002 | 12 | 309 | 4 | 3 | ₺2,700 |
The DateKey, ProductKey, CustomerKey and StoreKey fields in the fact table are the keys that connect it to the surrounding dimension tables.
4. How Are the Relationships Built?
The most common relationship type in a star schema is one-to-many (1:*). A product appears once in the dimension table, while the same product can match hundreds or thousands of sales rows in FactSales.
DimDate[DateKey]          1 ──→ * FactSales[DateKey]
DimProduct[ProductKey]    1 ──→ * FactSales[ProductKey]
DimCustomer[CustomerKey]  1 ──→ * FactSales[CustomerKey]
DimStore[StoreKey]        1 ──→ * FactSales[StoreKey]
When the filter flows from DimProduct to FactSales, the selected category or product automatically affects the sales measures.
Filter direction
In simple star schemas the dimension → fact direction gives a more controlled design for most scenarios.
Surrogate key
In enterprise models, matching dimension records with a stable key makes maintenance easier.
5. A Simple Sales Data Model
Imagine we are analysing the daily sales of a retail company. We have sales transactions, products, customers, stores and calendar information.
DimDate
DateKey, Date, Year, Quarter, Month, MonthName, Week, DayName
DimProduct
ProductKey, ProductName, Category, Brand, UnitPrice
DimCustomer
CustomerKey, CustomerName, Segment, City, Region
DimStore
StoreKey, StoreName, City, Region, StoreType
FactSales
SalesID, DateKey, ProductKey, CustomerKey, StoreKey, Quantity, SalesAmount, CostAmount
With this structure a question such as “in which month of 2026 did electronics sales in Istanbul grow?” can be answered from a single model. When the user picks a city from DimStore, a category from DimProduct and a year and month from DimDate, the measures on FactSales are filtered accordingly.
Simple DAX measures
Total Sales =
SUM(FactSales[SalesAmount])

Total Quantity =
SUM(FactSales[Quantity])

Total Cost =
SUM(FactSales[CostAmount])

Gross Profit =
[Total Sales] - [Total Cost]

Profit Margin =
DIVIDE([Gross Profit], [Total Sales])
6. How to Build a Star Schema in Power BI
Modeling in Power BI usually starts with preparing the data in Power Query, and the relationships are then created in the model view. To get good results, reduce unnecessary columns and unused data before the report stage.
Clean the data
Clean and shape the source tables in Power Query.
Separate the tables
Draw a clear line between fact and dimension tables.
Create keys
Define unique keys in the dimension tables.
Build relationships
Design the relationships as 1:* wherever possible.
Add a date table
Create the calendar as its own dimension.
Move logic into measures
Collect the calculations in measures as far as you can.
7. The Effect of the Model on Report Performance
Performance in Power BI is not only about hardware or the number of visuals. The structure of the model, the data volume, column cardinality, the relationships and the DAX queries all shape the result together.
The model gets simpler
Organising repeated fields within fact and dimension boundaries makes the model clearer.
Filtering becomes clear
The dimension → fact flow makes it predictable which measures a user's selection affects.
Measures stay readable
Measures focus on the numeric fields of the fact table; dimensions provide the analysis context.
Keeping product, customer, city and category information in dimension tables instead of repeating it endlessly in a huge sales table gives the model a more sensible structure. As the data volume grows, that simplicity and consistency become decisive.
8. Common Data Modeling Mistakes
| Mistake | Why is it a problem? | Better approach |
|---|---|---|
| Trying to solve everything with one table | Repeated fields, complexity and hard maintenance | A proper fact / dimension split |
| Too many many-to-many relationships | Filter flow and measure behaviour get complicated | Use a bridge table where needed |
| Unnecessary bidirectional filtering | Unexpected filter propagation | Keep a controlled single direction where possible |
| Not using a date table | Time intelligence and DAX date calculations get harder | Create a standard DimDate |
| Loading unnecessary columns | Model size and query cost grow | Keep only the fields you need |
9. A Checklist for a Good Power BI Model
The fact table
Does it represent a single business event? Is the grain clear? Are the measurable fields right?
The dimension tables
Are the filter and breakdown fields understandable? Are the keys unique? Is there needless repetition?
The relationships
Is the cardinality right? Does the filter direction behave as expected? Are there needlessly complex links?
Report performance
Has the model been cleared of unused fields? Do measures run in the right context? Were slow visuals investigated?
Conclusion: A Good Report Rests on a Good Model
Effective reporting in Power BI is not only about choosing charts. Building the data model correctly makes measures reliable, filters predictable, new analyses easy to add and the model comfortable to manage over time.
In the star schema approach the fact table keeps measurable events in the centre, while dimension tables describe those events through date, product, customer and store. Correct relationships and a simple model strengthen both the analytical quality and the usability of the report.
“Data modeling is one of the core skills that should come before report design.”