Jupyter Notebook Nedir? Veri Analistleri İçin Kullanım Rehberi
Kod, açıklama ve grafik aynı belgede. Jupyter Notebook'u kurmaktan hücre sırasının neden önemli olduğuna, bir analizi baştan sona yürütmekten paylaşmadan önce yapılacak son kontrole kadar pratik bir rehber.
- Araçlar
Jupyter Notebook nedir?
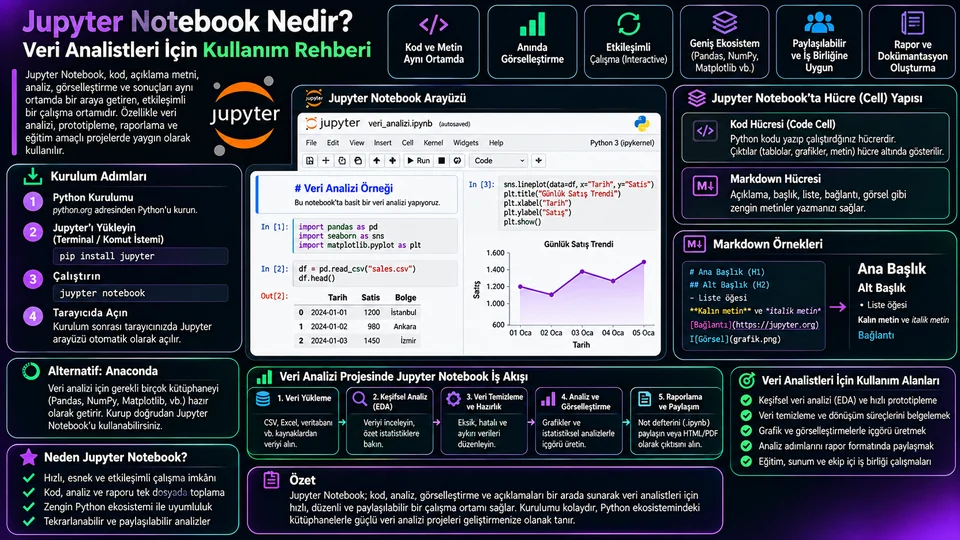
Jupyter Notebook, kod hücrelerini, açıklayıcı metni ve çalıştırma çıktılarını tek bir etkileşimli belgede toplayan bir çalışma ortamıdır. Analisti ilgilendiren kısım şu: kodu küçük parçalar hâlinde çalıştırıp ara sonucu hemen görebilir, o sonucun ne anlama geldiğini aynı dosyada yazabilirsiniz. Belge .ipynb uzantısıyla saklanır ve içinde kodun yanı sıra üretilen tablolar, grafikler ve metin de bulunur.
Arayüz, kodu asıl çalıştıran kernel ile konuşur. Python için bu kernel IPython'dur. Bir hücreyi çalıştırdığınızda kod kernel'e gider, sonuç hücrenin altına döner. Kernel arka planda bir oturum tutar; yani bir hücrede tanımladığınız değişken, sonraki hücrelerde de yaşamaya devam eder.
.py modüllerine taşıyıp notebook'u yalnızca keşif ve sunum için kullanmak bakımı kolaylaştırır.Kurulum ve ilk çalıştırma
Her proje için ayrı bir sanal ortam kurmak, paket sürümlerinin birbirine karışmasını engeller. Analiz projelerinde bu, aylar sonra "neden artık çalışmıyor?" sorusunu büyük ölçüde ortadan kaldırır.
# proje klasöründe sanal ortam
python -m venv .venv

# Windows PowerShell
.venv\Scripts\Activate.ps1
# macOS / Linux
source .venv/bin/activate

python -m pip install notebook pandas matplotlib
Ortam etkinken sunucuyu proje klasöründe başlatın. Tarayıcıda yerel bir arayüz açılır; oradan yeni bir Python notebook oluşturabilirsiniz.
jupyter notebookModuleNotFoundError gördüğünüzde paketi tekrar kurmadan önce hücrede import sys; print(sys.executable) yazıp hangi Python'un çalıştığına bakın.Hücre yapısı ve çalıştırma
Notebook üç tür hücre tanır. Code hücresi seçili kernel'de kod çalıştırır. Markdown hücresi başlık, liste, bağlantı, kalın yazı ve matematik ifadesi üretir. Raw hücre ise işlenmeden kalır; bazı dışa aktarma akışlarında ham içerik taşımak için kullanılır.
| İşlem | Kısayol | Sonuç |
|---|---|---|
| Çalıştır ve ilerle | Shift + Enter | Hücreyi çalıştırır, sonrakine geçer |
| Çalıştır ve kal | Ctrl + Enter | Hücreyi çalıştırır, seçim aynı hücrede kalır |
| Çalıştır ve alta ekle | Alt + Enter | Çalıştırır ve altına boş hücre açar |
| Kernel'i sıfırla | Menü: Kernel → Restart | Bellekteki tüm değişkenler silinir |
Burada dikkat edilmesi gereken bir ayrıntı var: hücrelerin görünür sırası ile çalıştırıldıkları sıra aynı olmak zorunda değildir. Hücrenin solundaki köşeli parantez içindeki sayı, o hücrenin kaçıncı sırada çalıştırıldığını gösterir. Yukarıdan aşağı 1, 2, 3 gitmiyorsa, belge başka birinin bilgisayarında aynı sonucu vermeyebilir.
Markdown ile analizi anlatın
Notebook'u komut listesinden rapora dönüştüren şey Markdown hücreleridir. Pratik bir düzen: koddan önce ne yapacağınızı ve hangi varsayımla yaptığınızı, koddan sonra çıkan sonucun ne anlama geldiğini yazın. Üç satırlık bir açıklama, altı ay sonra kendinize yazdığınız en değerli nottur.
# Aylık satış analizi

Sipariş kayıtlarından aylık ciro eğilimini çıkarıyoruz.

## Sorular
- Ciro aylara göre nasıl değişiyor?
- Hacmi en yüksek ürünler hangileri?

## Tanımlar
Ciro = adet × birim fiyat. İade satırları hariç tutuldu.
Başlıklar aynı zamanda gezinme aracıdır: uzun bir notebook'ta ## ile ayrılmış bölümler, içindekiler panelinde listelenir ve belgede dolaşmayı kolaylaştırır.
Bir analiz akışı baştan sona
Tipik akış dört adımdır: veriyi yükle, kaliteyi kontrol et, özeti çıkar, soruya uygun grafiği üret. Aşağıdaki örnek CSV sipariş kayıtlarından aylık ciroyu hesaplıyor.
import pandas as pd

df = pd.read_csv("data/siparisler.csv", parse_dates=["tarih"])

display(df.head())
print(df.shape)
display(df.dtypes)
display(df.isna().sum())
Bu dört satır, analizin geri kalanını kurtaran adımdır. shape satır sayısını, dtypes tarihin gerçekten tarih olarak okunup okunmadığını, isna().sum() ise hangi sütunda ne kadar boşluk olduğunu söyler. Bir de kendinize şunu sorun: bir satır neyi temsil ediyor? Her satır bir sipariş kalemi ise, satır sayısı sipariş sayısı değildir.
import matplotlib.pyplot as plt

df["ciro"] = df["adet"] * df["birim_fiyat"]

aylik = (df.set_index("tarih")["ciro"]
           .resample("MS")
           .sum())

display(aylik.to_frame())

ax = aylik.plot(marker="o", figsize=(10, 4))
ax.set(title="Aylık ciro", xlabel="Ay", ylabel="Ciro (TL)")
plt.tight_layout()
plt.show()
Grafik, kodun hemen altında hücre çıktısı olarak görünür. İki küçük alışkanlık işi ciddiye alınır hâle getirir: eksenlere birim yazmak ve grafiğin altına bir Markdown hücresinde ne gördüğünüzü bir cümleyle söylemek.
resample("MS") hiç kaydı olmayan bir ay için boşluk bırakmaz, 0 döndürür. Grafikte sıfıra inen bir ay gördüğünüzde "o ay satış olmadı" ile "o ayın verisi gelmemiş" aynı görünür. Kayıt sayısını da ayrıca sayın.Grafikler ve zengin çıktılar
Matplotlib görselleri doğrudan hücre çıktısı olarak gelir; plt.show() bunu açıkça tetikler. pandas da DataFrame'leri biçimli HTML tablosu olarak basar. Daha fazla etkileşim gerekiyorsa Plotly veya ipywidgets gibi kütüphaneler hücre içinde çalışan bileşenler üretebilir.
Çıktılar dosyanın içine kaydedilir. Bu, belgeyi kendi kendine yeten bir rapora dönüştürür ama iki yan etkisi vardır: dosya boyutu hızla büyür ve kaydedilmiş bir çıktı, kodu değiştirdikten sonra bile eski hâliyle orada durur. Büyük tabloları head() ile kısaltıp tam sonucu ayrı bir dosyaya yazmak iyi bir orta yoldur.
İyi notebook alışkanlıkları
Bir hücre, bir iş
Veri okuma, temizlik ve grafik ayrı hücrelerde dursun. Hata ayıklamak da, yeniden çalıştırmak da kolaylaşır.
Sırayı bozmayın
Yukarıdan aşağı çalışan bir belge hedefleyin. Hücreleri ileri geri çalıştırdığınız bir oturum tekrarlanabilir değildir.
Yolları tek yerde tutun
Dosya yollarını ve eşik değerlerini en üstteki bir hücrede değişken olarak tanımlayın.
Tekrarı modüle taşıyın
İki notebook'ta kopyaladığınız fonksiyon, artık src/ altında bir .py dosyasına aittir.
Bağımlılıkları yazın
requirements.txt veya eşdeğeri olmadan notebook başka bir makinede çalışmaz.
Hassas çıktıyı silin
Müşteri adı, e-posta, anahtar içeren çıktılar dosyaya gömülür. Paylaşmadan önce temizleyin.
Kaydetme, dışa aktarma, paylaşma
.ipynb dosyası aslında bir JSON belgesidir: hücreler, çıktılar ve kernel bilgisi içinde durur. Bu yüzden iki şeye dikkat edin. Birincisi, sürüm kontrolünde (Git) çıktı farkları okunmaz bir gürültü üretir; commit öncesi çıktıları temizlemek yaygın bir pratiktir. İkincisi, dosyayı birine gönderdiğinizde kodla birlikte bütün çıktıları da göndermiş olursunuz.
jupyter nbconvert --to html analiz.ipynbÜretilen HTML, dosyada kayıtlı olan çıktıları gösterir; hücreleri yeniden çalıştırmaz. Yani önce kernel'i sıfırlayıp baştan çalıştırmadan dışa aktarırsanız, rapora eski sonuçlar gider. Dönüştürmeden önce bir kez baştan çalıştırın, dışa aktardıktan sonra HTML'i de açıp göz gezdirin.
Sık karşılaşılan sorunlar
| Belirti | Olası neden | Ne yapmalı |
|---|---|---|
| ModuleNotFoundError | Kernel, paketi kurduğunuz ortam değil | sys.executable ile kontrol edin, doğru kernel'i seçin |
| NameError: değişken tanımsız | Hücreler farklı sırada çalıştı veya kernel sıfırlandı | Restart & Run All ile baştan çalıştırın |
| Çıktı kodla uyuşmuyor | Hücre değiştirildi ama yeniden çalıştırılmadı | Hücre numaralarına bakın, baştan çalıştırın |
| Dosya devasa büyüdü | Gömülü grafikler ve büyük tablo çıktıları | Çıktıları temizleyin, büyük sonuçları dosyaya yazın |
| Grafik görünmüyor | Figür gösterilmeden kapandı veya backend sorunu | plt.show() ekleyin, kernel'i yeniden başlatın |
Sonuç
Jupyter Notebook'un gücü, düşünme sürecini görünür kılmasıdır: veriyi yoklarsınız, ne gördüğünüzü yazarsınız, bir sonraki adıma geçersiniz. Bu esneklik aynı zamanda en büyük riskidir — sırası bozulmuş, çıktıları eskimiş bir belge güven vermez.
Pratik kural basit: hücreleri küçük tutun, her bölümü bir cümleyle anlatın ve paylaşmadan önce kernel'i sıfırlayıp baştan çalıştırın. Bu üç alışkanlıkla notebook, yalnızca sizin çalıştığınız bir müsvedde olmaktan çıkıp başkasının takip edebileceği bir belgeye dönüşür.
What is Jupyter Notebook?
Jupyter Notebook is a working environment that brings code cells, explanatory text and execution output together in a single interactive document. The part that matters to an analyst is this: you can run code in small pieces, see the intermediate result immediately, and write down what it means in the same file. The document is stored with an .ipynb extension and holds not just the code but the tables, charts and text it produced.
The interface talks to a kernel, which is what actually runs the code. For Python that kernel is IPython. When you run a cell, the code goes to the kernel and the result comes back underneath it. The kernel keeps a session alive in the background, so a variable defined in one cell is still there in the next.
.py modules and keeping the notebook for exploration and presentation makes maintenance much easier.Installing and first run
Creating a separate virtual environment per project keeps package versions from colliding. In analysis projects this largely eliminates the "why doesn't this work any more?" question months later.
# virtual environment in the project folder
python -m venv .venv

# Windows PowerShell
.venv\Scripts\Activate.ps1
# macOS / Linux
source .venv/bin/activate

python -m pip install notebook pandas matplotlib
With the environment active, start the server inside the project folder. A local interface opens in the browser, and from there you can create a new Python notebook.
jupyter notebookModuleNotFoundError, before reinstalling anything, run import sys; print(sys.executable) in a cell and check which Python is actually running.Cell types and execution
A notebook knows three kinds of cell. A Code cell runs code in the selected kernel. A Markdown cell produces headings, lists, links, bold text and mathematical expressions. A Raw cell is left unprocessed; it is used to carry verbatim content through certain export pipelines.
| Action | Shortcut | Result |
|---|---|---|
| Run and advance | Shift + Enter | Runs the cell, moves to the next one |
| Run and stay | Ctrl + Enter | Runs the cell, selection stays put |
| Run and insert below | Alt + Enter | Runs it and opens an empty cell underneath |
| Reset the kernel | Menu: Kernel → Restart | Clears every variable in memory |
One detail deserves attention here: the visible order of cells and the order they were executed in do not have to match. The number in square brackets next to a cell shows its execution position. If it does not read 1, 2, 3 from top to bottom, the document may not produce the same result on somebody else's machine.
Narrate the analysis with Markdown
Markdown cells are what turn a notebook from a list of commands into a report. A practical layout: before the code, say what you are about to do and on what assumption; after the code, say what the result means. Three lines of explanation are the most valuable note you will ever write to your future self.
# Monthly sales analysis

We derive the monthly revenue trend from order records.

## Questions
- How does revenue change month to month?
- Which products carry the most volume?

## Definitions
Revenue = quantity × unit price. Return rows are excluded.
Headings double as navigation: in a long notebook, sections separated by ## are listed in the table-of-contents panel and make moving around far easier.
An analysis flow end to end
The typical flow has four steps: load the data, check its quality, summarise it, then draw the chart the question calls for. The example below computes monthly revenue from CSV order records.
import pandas as pd

df = pd.read_csv("data/orders.csv", parse_dates=["date"])

display(df.head())
print(df.shape)
display(df.dtypes)
display(df.isna().sum())
These four lines are the step that saves the rest of the analysis. shape gives the row count, dtypes tells you whether the date was really parsed as a date, and isna().sum() shows how much is missing in each column. Then ask yourself one more thing: what does a single row represent? If each row is an order line, the row count is not the order count.
import matplotlib.pyplot as plt

df["revenue"] = df["quantity"] * df["unit_price"]

monthly = (df.set_index("date")["revenue"]
             .resample("MS")
             .sum())

display(monthly.to_frame())

ax = monthly.plot(marker="o", figsize=(10, 4))
ax.set(title="Monthly revenue", xlabel="Month", ylabel="Revenue")
plt.tight_layout()
plt.show()
The chart appears as cell output right below the code. Two small habits make the work look serious: put units on the axes, and add a Markdown cell underneath saying in one sentence what you see.
resample("MS") does not leave a gap for a month with no records — it returns 0. On the chart, "no sales that month" and "that month's data never arrived" look identical. Count the records separately as well.Charts and rich output
Matplotlib figures appear directly as cell output, and plt.show() triggers that explicitly. pandas renders DataFrames as formatted HTML tables. If you need more interaction, libraries such as Plotly or ipywidgets can produce components that run inside the cell.
Output is saved into the file itself. That turns the document into a self-contained report, but it has two side effects: the file grows quickly, and a saved output stays there in its old form even after you change the code. Trimming large tables with head() and writing the full result to a separate file is a good middle ground.
Good notebook habits
One cell, one job
Keep loading, cleaning and plotting in separate cells. Both debugging and re-running get easier.
Don't break the order
Aim for a document that runs top to bottom. A session where you jumped back and forth is not reproducible.
Keep paths in one place
Define file paths and threshold values as variables in a single cell at the top.
Move repetition into modules
A function you have copied into two notebooks now belongs in a .py file under src/.
Write down dependencies
Without a requirements.txt or equivalent, the notebook will not run on another machine.
Strip sensitive output
Customer names, e-mails and keys get embedded in the file. Clear them before sharing.
Saving, exporting, sharing
An .ipynb file is really a JSON document: cells, outputs and kernel metadata all live inside it. That has two consequences. First, in version control (Git), output diffs produce unreadable noise, so clearing outputs before committing is a common practice. Second, when you send the file to someone, you send all of its output along with the code.
jupyter nbconvert --to html analysis.ipynbThe generated HTML shows the output stored in the file; it does not re-run any cells. So if you export without restarting and re-running first, stale results go into the report. Run it from the top once before converting, and open the HTML afterwards to look it over.
Common problems
| Symptom | Likely cause | What to do |
|---|---|---|
| ModuleNotFoundError | The kernel is not the environment you installed into | Check sys.executable, pick the right kernel |
| NameError: variable undefined | Cells ran out of order, or the kernel was reset | Restart & Run All from the top |
| Output doesn't match the code | The cell was edited but not re-run | Check the execution numbers, run from the top |
| File became enormous | Embedded figures and large table output | Clear outputs, write big results to a file |
| Chart doesn't show | The figure was closed before display, or a backend issue | Add plt.show(), restart the kernel |
Conclusion
The strength of Jupyter Notebook is that it makes the thinking process visible: you probe the data, write down what you see, move to the next step. That flexibility is also its biggest risk — a document with a scrambled execution order and stale output does not inspire confidence.
The practical rule is simple: keep cells small, narrate each section in a sentence, and restart the kernel and run everything before sharing. With those three habits, a notebook stops being a private scratchpad and becomes a document someone else can follow.