Aylık Satış Raporunu Tek Tuşa İndirmek: Excel VBAOne-Click Monthly Sales Report with Excel VBA
541.910 satırlık satış verisinden ham dosyayı okuyan, satırları sınıflandıran, raporu kurup PDF'e çeviren bir makro yazdım. 13 aylık raporun tamamı 26,8 saniyede hazır; rakamlar Python ile birebir doğrulandı.I wrote a macro that reads 541,910 rows of raw sales data, classifies the rows, builds the report and exports it to PDF. All 13 monthly reports are ready in 26.8 seconds, and the figures were validated against Python.
- Excel
- VBA
- Otomasyon
- Python
Elle hazırlanan aylık rapor
Aylık satış raporu çoğu ekipte aynı adımlarla hazırlanır: ham dışa aktarım açılır, iptal ve kargo satırları filtrelenir, pivot tablolarla ciro, sipariş ve müşteri sayısı çıkarılır, önceki ayla karşılaştırılır, grafikler güncellenir ve PDF olarak gönderilir. Adımlar her ay aynıdır ama elle yapıldığı için hem zaman alır hem de bir filtrenin unutulması rakamları sessizce değiştirir.
Bu çalışmada bu süreci tek tuşa indiren bir Excel VBA makrosu yazdım. Veri, bir online perakendecinin 541.910 satırlık Aralık 2010 – Aralık 2011 satış kayıtları (UCI Online Retail II). Makro kaynak dosyayı okuyor, her satırı sınıflandırıyor, seçilen ay için raporu kuruyor ve PDF'e çeviriyor; istenirse verideki 13 ayın tamamı için ayrı ayrı PDF üretiyor.
Makro ne yapıyor?
- Ayarlar sayfası: kaynak dosya, sayfa adı, rapor ayı ve PDF klasörü tek yerde. Kodu açmadan değiştirilebiliyor.
- Tek okuma: kaynak dosya salt okunur açılıyor, tüm sayfa tek komutla belleğe (diziye) alınıyor ve dosya kapanıyor. Hücre hücre okumak yerine dizi kullanmak işi saniyelere indiriyor.
- Sınıflandırma: her satır satış, iade, hizmet kodu ya da geçersiz olarak ayrılıyor.
- Tek geçişte özet: ay bazında brüt satış, iade, tekil sipariş ve müşteri, günlük seri, ürün ve ülke kırılımı sözlüklerde (Scripting.Dictionary) toplanıyor.
- Rapor sayfası: KPI kartları (önceki aya göre değişimle), günlük satış grafiği, en çok satan 10 ürün ve ülke dağılımı sıfırdan kuruluyor.
- PDF ve kayıt: sayfa tek sayfalık A4 PDF olarak kaydediliyor; her çalışma okunan satır sayıları ve süreyle Log sayfasına yazılıyor.
' Kaynak dosyayı salt okunur aç, tüm sayfayı tek seferde diziye al, kapat
Set wb = Workbooks.Open(Filename:=src, ReadOnly:=True, UpdateLinks:=False)
arr = wb.Worksheets(sheetName).UsedRange.Value
wb.Close SaveChanges:=False
Tek bir ayın raporu, kaynak dosyanın açılması dahil 12,9 saniye sürüyor; bunun yaklaşık 5 saniyesi 45 MB'lık dosyanın açılması. TumAylar makrosu veriyi yalnızca bir kez okuduğu için 13 ayın raporu ve PDF'i 26,8 saniyede bitiyor.
Hangi satır satıştır?
Raporun doğruluğu kodun hızından önce bu karardan geçiyor. Ham veride satışın yanında iptal faturaları (C ile başlayan), kargo ve banka masrafı gibi ürün olmayan kalemler ve miktarı ya da fiyatı sıfır olan düzeltme satırları da var. Makro bunları şu kurallarla ayırıyor:
| Sınıf | Kural | Satır | Pay |
|---|---|---|---|
| Satış | Fatura C ile başlamıyor, miktar ve fiyat > 0, ürün kodu | 527.789 | %97,4 |
| İade | C ile başlayan iptal faturası | 8.704 | %1,6 |
| Hizmet kodu | POST, DOT, M, BANK CHARGES, AMAZONFEE… | 2.917 | %0,5 |
| Geçersiz | Miktar ya da fiyat ≤ 0 olan düzeltmeler | 2.500 | %0,5 |
For r = 2 To UBound(arr, 1)
    If IsServiceCode(code) Then
        nSvc = nSvc + 1                         ' kargo, banka masrafı...
    ElseIf Left$(inv, 1) = "C" Then
        AddNum mIade, mk, -amt                  ' iptal faturası = iade
    ElseIf qty <= 0 Or price <= 0 Then
        nBad = nBad + 1
    Else
        AddNum mBrut, mk, amt                   ' ay bazında brüt satış
        Sub2(mInv, mk).Item(inv) = 1            ' tekil sipariş
        Sub2(mCust, mk).Item(cust) = 1          ' tekil müşteri
        AddNum Sub2(mProd, mk), code, amt       ' ürün kırılımı
    End If
Next r
Net satış = brüt satış − aynı aydaki iadeler. Sipariş ve müşteri sayıları tekil sayılıyor; aynı fatura numarasının onlarca satırı tek sipariş.
Çıktı: tek sayfalık rapor
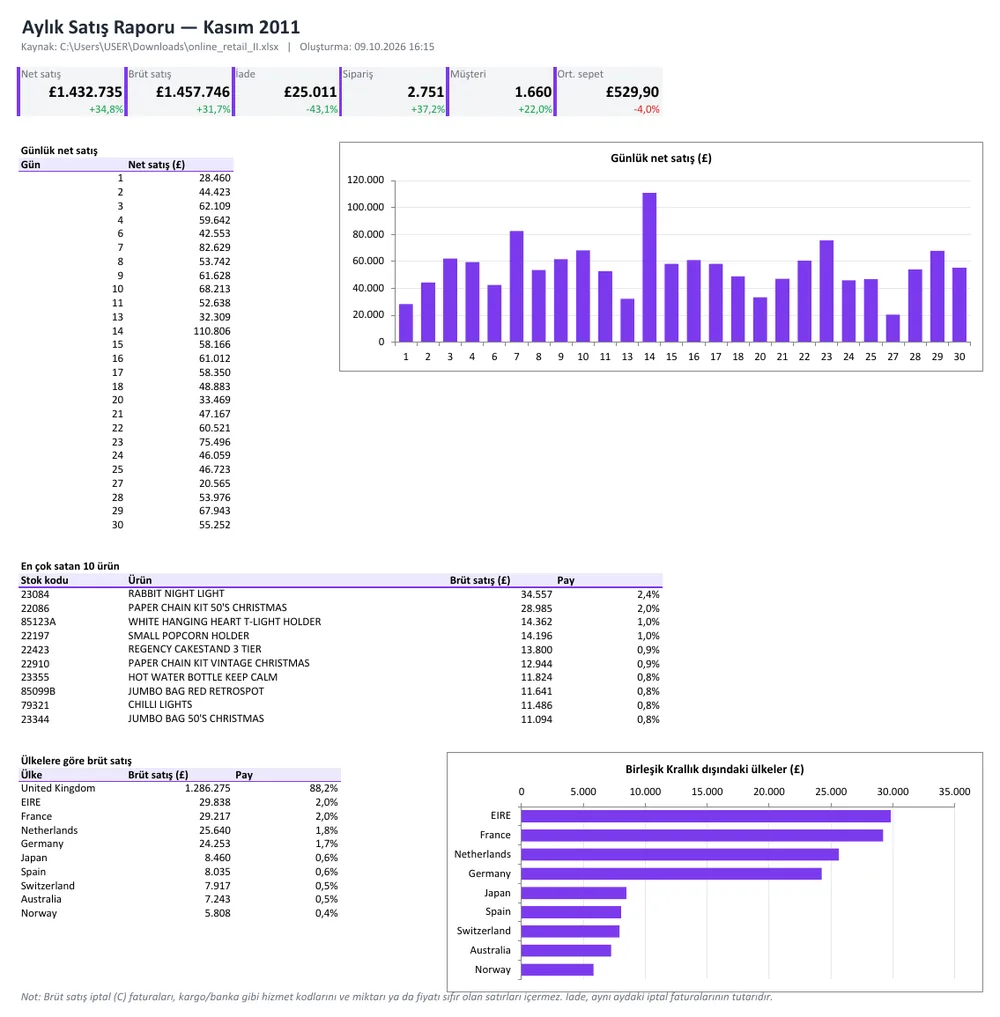
Kasım 2011 için makronun ürettiği PDF aşağıda. Net satış £1.432.735, önceki aya göre %34,8 artış; sipariş sayısı 2.751. Sepet ortalaması ise %4,0 düşmüş: yılbaşı öncesi sipariş sayısı cirodan hızlı artıyor.
Aralık 2011 verisi 9 Aralık'ta bitiyor; ay yarım.
Rakamlar doğru mu?
Bir otomasyonun hızlı olması yetmez, rakamlarının güvenilir olması gerekir. Aynı kuralları Python'da (pandas) bağımsız olarak yazdım ve makronun ürettiği 13 PDF'teki altı KPI'ı (net, brüt, iade, sipariş, müşteri, sepet) PDF metninden okuyup karşılaştırdım. 78 değerin hepsi birebir tuttu; satır sınıflarının sayıları da aynı.
| Ay | Brüt (VBA) | Brüt (Python) | Sipariş VBA | Python | Müşteri VBA | Python | Eşleşme |
|---|---|---|---|---|---|---|---|
| Ara '10 | £778.008 | £778.008 | 1.550 | 1.550 | 884 | 884 | ✓ |
| Oca '11 | £671.992 | £671.992 | 1.081 | 1.081 | 739 | 739 | ✓ |
| Şub '11 | £508.953 | £508.953 | 1.093 | 1.093 | 757 | 757 | ✓ |
| Mar '11 | £691.266 | £691.266 | 1.440 | 1.440 | 973 | 973 | ✓ |
| Nis '11 | £516.310 | £516.310 | 1.235 | 1.235 | 853 | 853 | ✓ |
| May '11 | £741.276 | £741.276 | 1.668 | 1.668 | 1.054 | 1.054 | ✓ |
| Haz '11 | £738.877 | £738.877 | 1.525 | 1.525 | 990 | 990 | ✓ |
| Tem '11 | £689.398 | £689.398 | 1.452 | 1.452 | 946 | 946 | ✓ |
| Ağu '11 | £725.605 | £725.605 | 1.339 | 1.339 | 933 | 933 | ✓ |
| Eyl '11 | £1.030.500 | £1.030.500 | 1.818 | 1.818 | 1.259 | 1.259 | ✓ |
| Eki '11 | £1.106.686 | £1.106.686 | 2.005 | 2.005 | 1.361 | 1.361 | ✓ |
| Kas '11 | £1.457.746 | £1.457.746 | 2.751 | 2.751 | 1.660 | 1.660 | ✓ |
| Ara '11 | £615.502 | £615.502 | 816 | 816 | 614 | 614 | ✓ |
Otomasyon hesaplar, yorumu insan yapar
Aralık 2011 raporunda iade bir önceki aya göre yaklaşık yedi kat artmış görünüyor (£174.127). Raporun ürün tablosuna bakınca sebep çıkıyor: tek bir müşteri 9 Aralık sabahı aynı üründen 80.995 adet sipariş vermiş (£168.470) ve sipariş 12 dakika sonra iptal edilmiş. Aynı durum Ocak 2011'de de var: 74.215 adetlik £77.184 tutarında bir sipariş 16 dakika içinde iptal.
Net satış bu durumda doğru, çünkü satış ve iade birbirini götürüyor. Ama brüt satış, iade oranı ve “en çok satan ürün” listesi yanıltıcı: Aralık'ta bu tek ürün brüt satışın %27,4'ünü oluşturuyor. Bu yüzden raporda brüt ile netin yan yana durması önemli; bir sonraki adım olarak aynı gün açılıp kapanan büyük siparişleri ayrıca işaretleyen bir kontrol eklenebilir.
Sınırlar
- Makro
Scripting.Dictionarykullanıyor; Windows Excel'de çalışır, Mac Excel'de çalışmaz. - Excel sayfası 1.048.576 satırla sınırlı; daha büyük veri için Power Query ya da veritabanı daha uygun.
- Kurallar bu veri setine göre yazıldı (hizmet kodları, C faturaları). Başka bir kaynakta IsServiceCode listesi güncellenmeli.
- Süreler tek bir bilgisayarda ölçüldü; dosya açma süresi diske ve dosya boyutuna göre değişir.
Dosyalar
Makroyu kendi verinizde denemek için: RaporModulu.bas (VBA modülü) ve Rapor_Otomasyonu.xlsx (ayar sayfası). Excel'de Alt+F11 → File → Import File ile modülü ekleyip dosyayı .xlsm olarak kaydetmeniz yeterli. Veri: UCI Online Retail II (CC BY 4.0).
The monthly report, by hand
In most teams the monthly sales report is built with the same steps: open the raw export, filter out cancellations and shipping lines, use pivot tables for revenue, orders and customers, compare with last month, refresh the charts and send a PDF. The steps never change, yet doing them by hand takes time and a forgotten filter silently changes the numbers.
For this case study I wrote an Excel VBA macro that turns that process into one click. The data is 541,910 rows of an online retailer's sales from December 2010 to December 2011 (UCI Online Retail II). The macro reads the source file, classifies every row, builds the report for the chosen month and exports it to PDF; optionally it produces a separate PDF for each of the 13 months in the data.
What the macro does
- Settings sheet: source file, sheet name, report month and PDF folder in one place, editable without opening the code.
- Single read: the source file opens read-only, the whole sheet is loaded into memory (an array) with one statement and the file closes. Using an array instead of reading cell by cell brings the work down to seconds.
- Classification: every row is labelled as a sale, a return, a service code or invalid.
- Summary in one pass: gross sales, returns, distinct orders and customers, a daily series, and product and country breakdowns are accumulated per month in dictionaries (Scripting.Dictionary).
- Report sheet: KPI cards (with change vs the previous month), a daily sales chart, the top 10 products and the country split are built from scratch.
- PDF and log: the sheet is saved as a one-page A4 PDF; each run is written to a Log sheet with row counts and run time.
' Kaynak dosyayı salt okunur aç, tüm sayfayı tek seferde diziye al, kapat
Set wb = Workbooks.Open(Filename:=src, ReadOnly:=True, UpdateLinks:=False)
arr = wb.Worksheets(sheetName).UsedRange.Value
wb.Close SaveChanges:=False
One month's report takes 12.9 seconds including opening the source file, of which about 5 seconds is opening the 45 MB file. Because the TumAylar macro reads the data only once, all 13 reports and PDFs are done in 26.8 seconds.
Which rows count as sales?
Before speed, the report's correctness depends on this decision. Besides sales, the raw data contains cancellation invoices (starting with C), non-product lines such as postage and bank charges, and adjustment rows with zero quantity or price. The macro separates them with these rules:
| Class | Rule | Rows | Share |
|---|---|---|---|
| Sale | Invoice not starting with C, quantity and price > 0, product code | 527,789 | 97.4% |
| Return | Cancellation invoice starting with C | 8,704 | 1.6% |
| Service code | POST, DOT, M, BANK CHARGES, AMAZONFEE… | 2,917 | 0.5% |
| Invalid | Adjustments with quantity or price ≤ 0 | 2,500 | 0.5% |
For r = 2 To UBound(arr, 1)
    If IsServiceCode(code) Then
        nSvc = nSvc + 1                         ' kargo, banka masrafı...
    ElseIf Left$(inv, 1) = "C" Then
        AddNum mIade, mk, -amt                  ' iptal faturası = iade
    ElseIf qty <= 0 Or price <= 0 Then
        nBad = nBad + 1
    Else
        AddNum mBrut, mk, amt                   ' ay bazında brüt satış
        Sub2(mInv, mk).Item(inv) = 1            ' tekil sipariş
        Sub2(mCust, mk).Item(cust) = 1          ' tekil müşteri
        AddNum Sub2(mProd, mk), code, amt       ' ürün kırılımı
    End If
Next r
Net sales = gross sales − returns in the same month. Orders and customers are counted as distinct values; dozens of lines with the same invoice number are one order.
Output: a one-page report
Below is the PDF the macro produced for November 2011. Net sales £1,432,735, up 34.8% on the previous month; 2,751 orders. Average basket fell 4.0%: before Christmas, order count grows faster than revenue.
December 2011 data ends on 9 December; the month is partial.
Are the numbers right?
Being fast is not enough; an automation's numbers have to be trustworthy. I wrote the same rules independently in Python (pandas), read the six KPIs (net, gross, returns, orders, customers, basket) from the text of the 13 PDFs the macro produced, and compared them. All 78 values matched exactly; so did the row counts per class.
| Month | Gross (VBA) | Gross (Python) | Orders VBA | Python | Cust. VBA | Python | Match |
|---|---|---|---|---|---|---|---|
| Dec 10 | £778,008 | £778,008 | 1,550 | 1,550 | 884 | 884 | ✓ |
| Jan 11 | £671,992 | £671,992 | 1,081 | 1,081 | 739 | 739 | ✓ |
| Feb 11 | £508,953 | £508,953 | 1,093 | 1,093 | 757 | 757 | ✓ |
| Mar 11 | £691,266 | £691,266 | 1,440 | 1,440 | 973 | 973 | ✓ |
| Apr 11 | £516,310 | £516,310 | 1,235 | 1,235 | 853 | 853 | ✓ |
| May 11 | £741,276 | £741,276 | 1,668 | 1,668 | 1,054 | 1,054 | ✓ |
| Jun 11 | £738,877 | £738,877 | 1,525 | 1,525 | 990 | 990 | ✓ |
| Jul 11 | £689,398 | £689,398 | 1,452 | 1,452 | 946 | 946 | ✓ |
| Aug 11 | £725,605 | £725,605 | 1,339 | 1,339 | 933 | 933 | ✓ |
| Sep 11 | £1,030,500 | £1,030,500 | 1,818 | 1,818 | 1,259 | 1,259 | ✓ |
| Oct 11 | £1,106,686 | £1,106,686 | 2,005 | 2,005 | 1,361 | 1,361 | ✓ |
| Nov 11 | £1,457,746 | £1,457,746 | 2,751 | 2,751 | 1,660 | 1,660 | ✓ |
| Dec 11 | £615,502 | £615,502 | 816 | 816 | 614 | 614 | ✓ |
The macro calculates; a person interprets
In the December 2011 report, returns look about seven times higher than the previous month (£174,127). The product table shows why: on the morning of 9 December one customer ordered 80,995 units of a single product (£168,470) and the order was cancelled 12 minutes later. The same happened in January 2011: a 74,215-unit order worth £77,184 cancelled within 16 minutes.
Net sales are right here, because the sale and the return cancel out. But gross sales, the return rate and the top-product list are misleading: in December this one product makes up 27.4% of gross sales. That is why gross and net sit side by side in the report; a natural next step is a check that flags large orders opened and cancelled on the same day.
Limitations
- The macro uses
Scripting.Dictionary; it runs in Excel for Windows, not in Excel for Mac. - An Excel sheet is limited to 1,048,576 rows; for larger data Power Query or a database is a better fit.
- The rules are written for this dataset (service codes, C invoices). For another source the IsServiceCode list needs updating.
- Timings were measured on a single computer; file-open time depends on the disk and the file size.
Files
To try the macro on your own data: RaporModulu.bas (the VBA module) and Rapor_Otomasyonu.xlsx (the settings sheet). In Excel, add the module with Alt+F11 → File → Import File and save the file as .xlsm. Data: UCI Online Retail II (CC BY 4.0).